
WELLTOWER INC. (WELL) FY2026 Q1 Balance Sheet
As of 2026-03-31
Balance Sheet
As of 2026-03-31
Swipe to see the full flow
Chart details
WELLTOWER INC. (WELL) FY2026 Q1 Balance Sheet
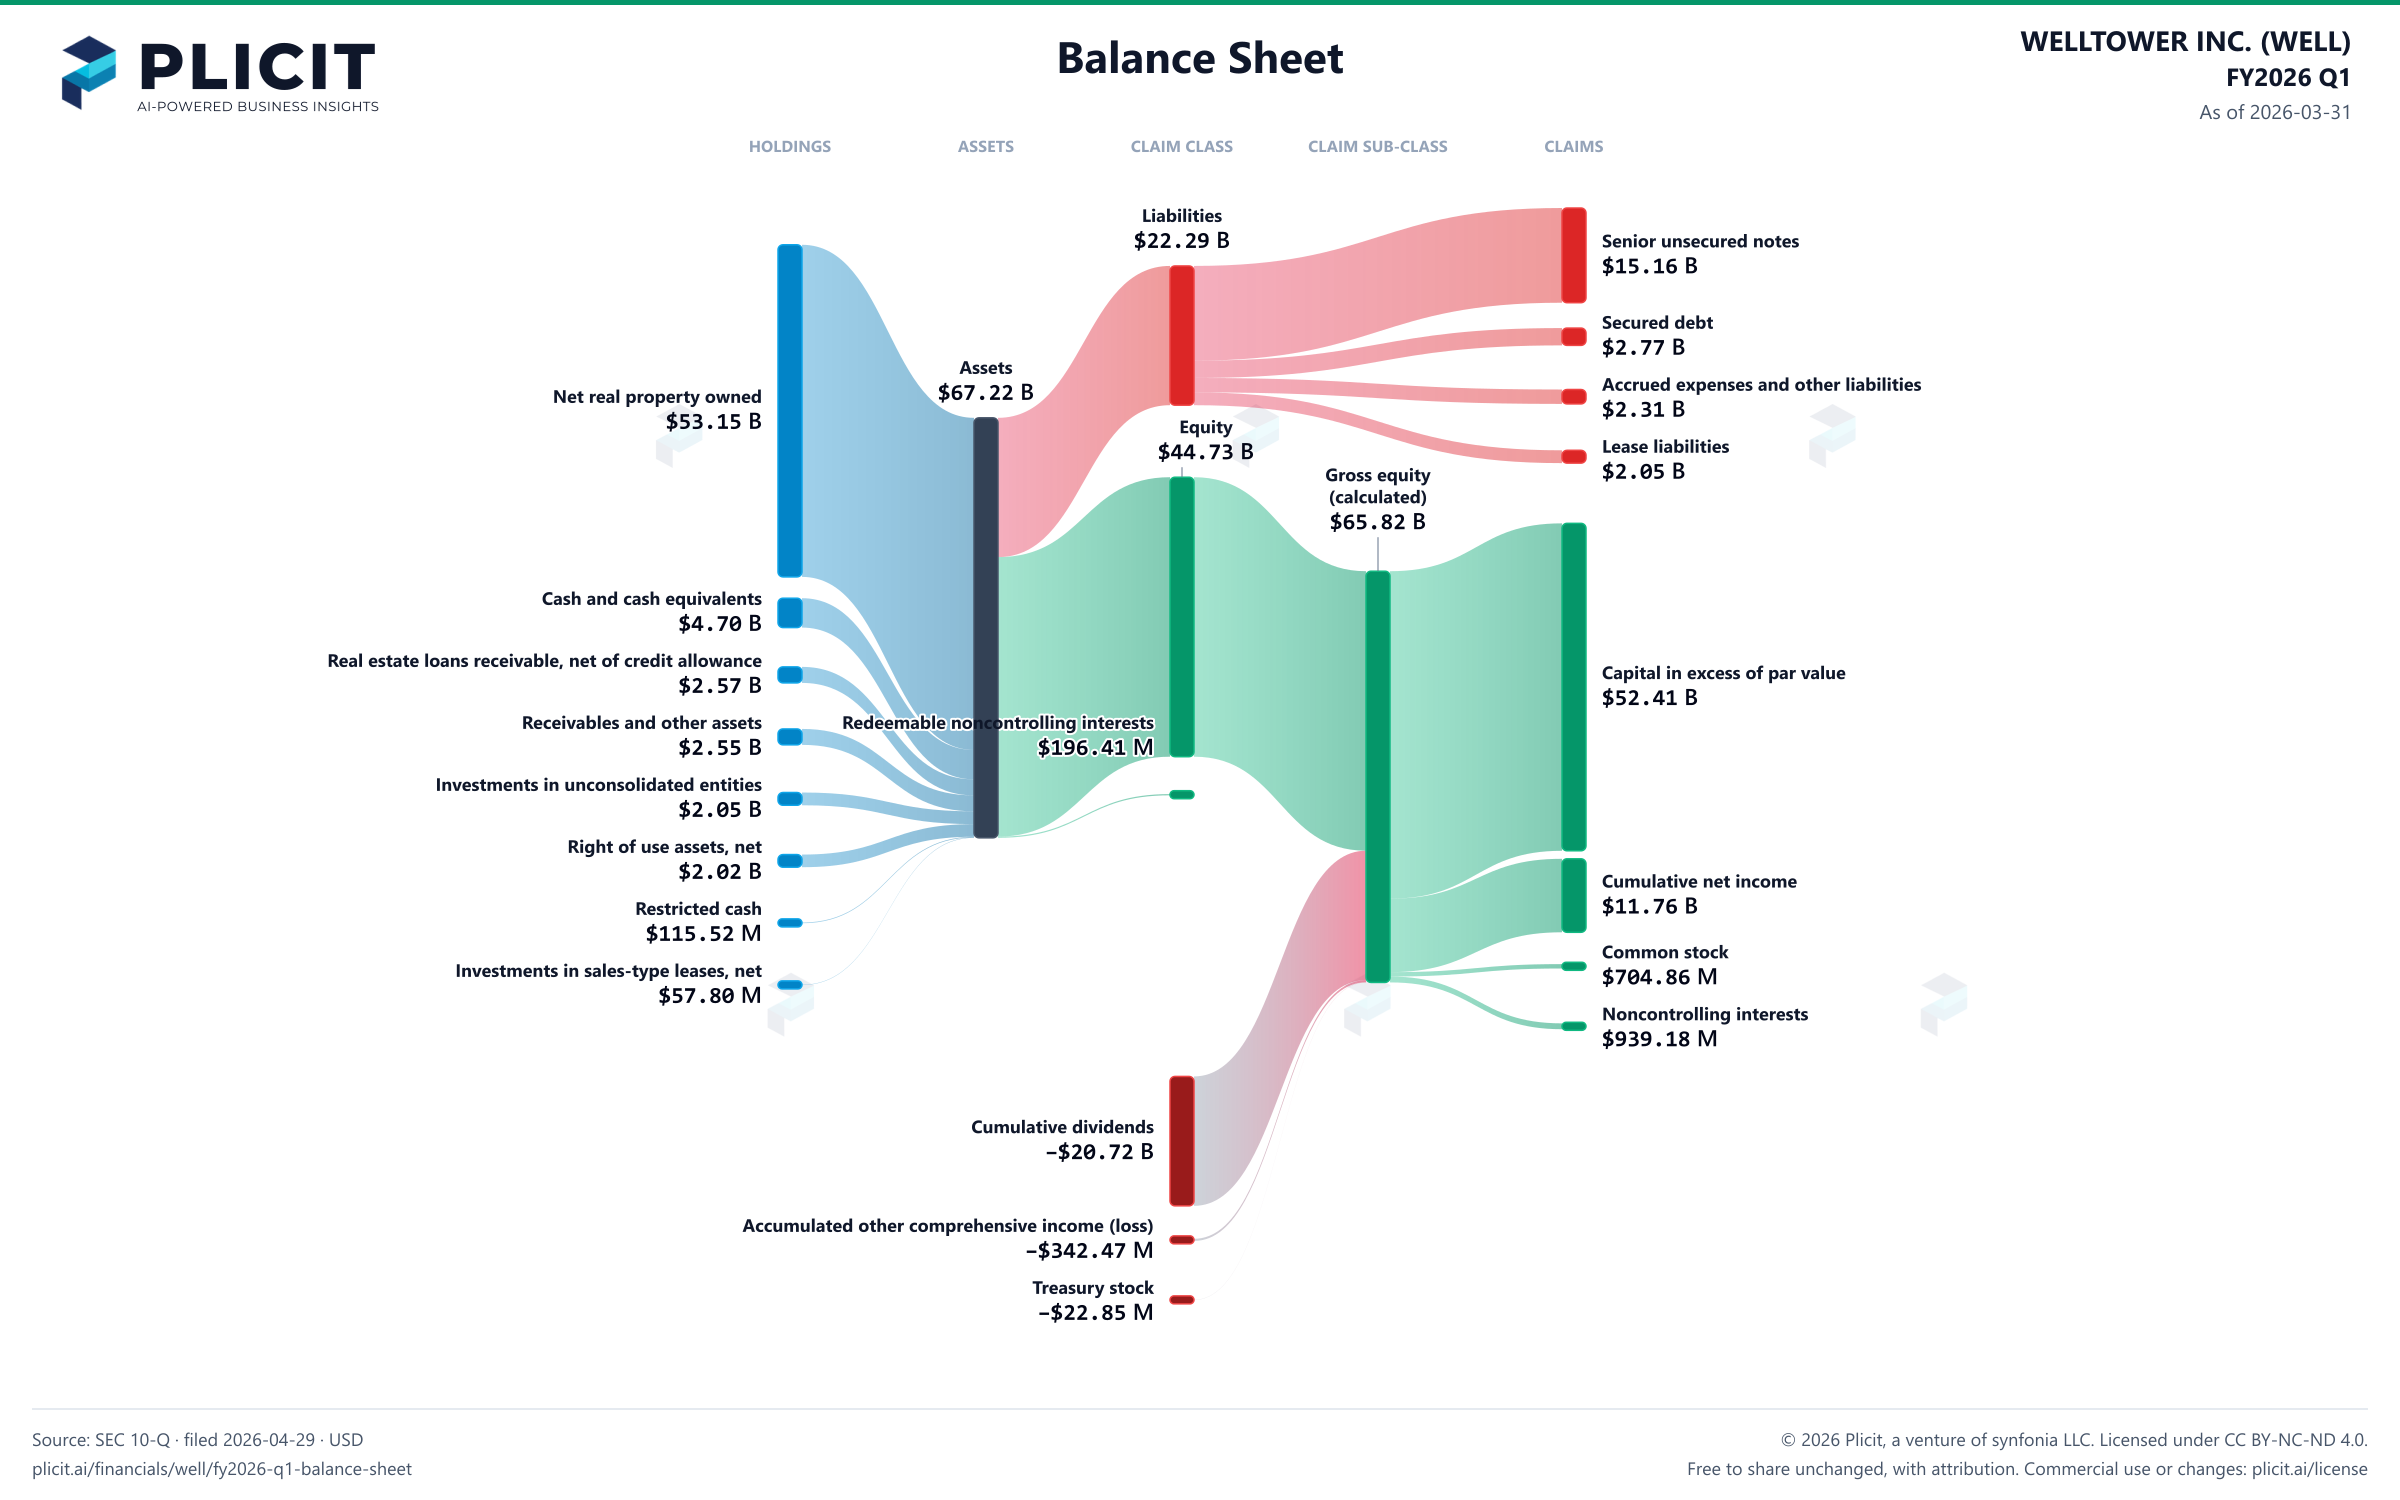
Balance sheet as of 2026-03-31. The chart shows assets, liabilities and equity at that date.
- Assets
- 67,220,556,000 US dollars
- Liabilities
- 22,291,286,000 US dollars
- Equity
- 44,732,859,000 US dollars
- Redeemable noncontrolling interests
- 196,411,000 US dollars
- Noncontrolling interest
- 939,184,000 US dollars. Included in consolidated equity; this amount is not added again.
- Land and land improvements
- 6,736,066,000 US dollars. Part of Net real property owned , drawn as one net amount.
- Buildings and improvements
- 52,873,371,000 US dollars. Part of Net real property owned , drawn as one net amount.
- Acquired lease intangibles
- 2,853,696,000 US dollars. Part of Net real property owned , drawn as one net amount.
- Real property held for sale, net of accumulated depreciation
- 749,426,000 US dollars. Part of Net real property owned , drawn as one net amount.
- Construction in progress
- 764,223,000 US dollars. Part of Net real property owned , drawn as one net amount.
- Less accumulated depreciation and amortization
- negative 10,822,151,000 US dollars. Part of Net real property owned , drawn as one net amount.
- Net real property owned
- 53,154,631,000 US dollars
- Cash and cash equivalents
- 4,703,775,000 US dollars
- Real estate loans receivable, net of credit allowance
- 2,567,564,000 US dollars
- Receivables and other assets
- 2,553,021,000 US dollars
- Investments in unconsolidated entities
- 2,045,081,000 US dollars
- Right of use assets, net
- 2,023,166,000 US dollars
- Restricted cash
- 115,518,000 US dollars
- Investments in sales-type leases, net
- 57,800,000 US dollars
- Senior unsecured notes
- 15,159,712,000 US dollars
- Secured debt
- 2,773,856,000 US dollars
- Accrued expenses and other liabilities
- 2,306,445,000 US dollars
- Lease liabilities
- 2,051,273,000 US dollars
- Unsecured credit facility and commercial paper
- 0 US dollars
- Capital in excess of par value
- 52,409,593,000 US dollars
- Cumulative net income
- 11,762,241,000 US dollars
- Common stock
- 704,860,000 US dollars
- Noncontrolling interests
- 939,184,000 US dollars
- Cumulative dividends
- negative 20,717,700,000 US dollars
- Accumulated other comprehensive income (loss)
- negative 342,466,000 US dollars
- Treasury stock
- negative 22,853,000 US dollars
- Gross equity (calculated)
- 65,815,878,000 US dollars. Net equity plus the magnitudes of its negative contributions equals gross positive equity. The negative contributions enter this reconciliation as add-backs; their filed signs stay negative.
Chart connections
- Assets equal liabilities plus temporary equity plus consolidated equity. Consolidated equity includes noncontrolling interests when reported.
- Treasury shares and other negative equity contributions reduce equity.
Free to share unchanged, with credit to Plicit.ai · CC BY-NC-ND 4.0Download PNG
Product waitlist
Health Check and Teardown for your own company
A health check uncovers insights of your private books, not a public ticker. Join this list to get notified as soon as we go-live!