
WELLTOWER INC. (WELL) FY2024 Annual Balance Sheet
As of 2024-12-31
Balance Sheet
As of 2024-12-31
Swipe to see the full flow
Chart details
WELLTOWER INC. (WELL) FY2024 Annual Balance Sheet
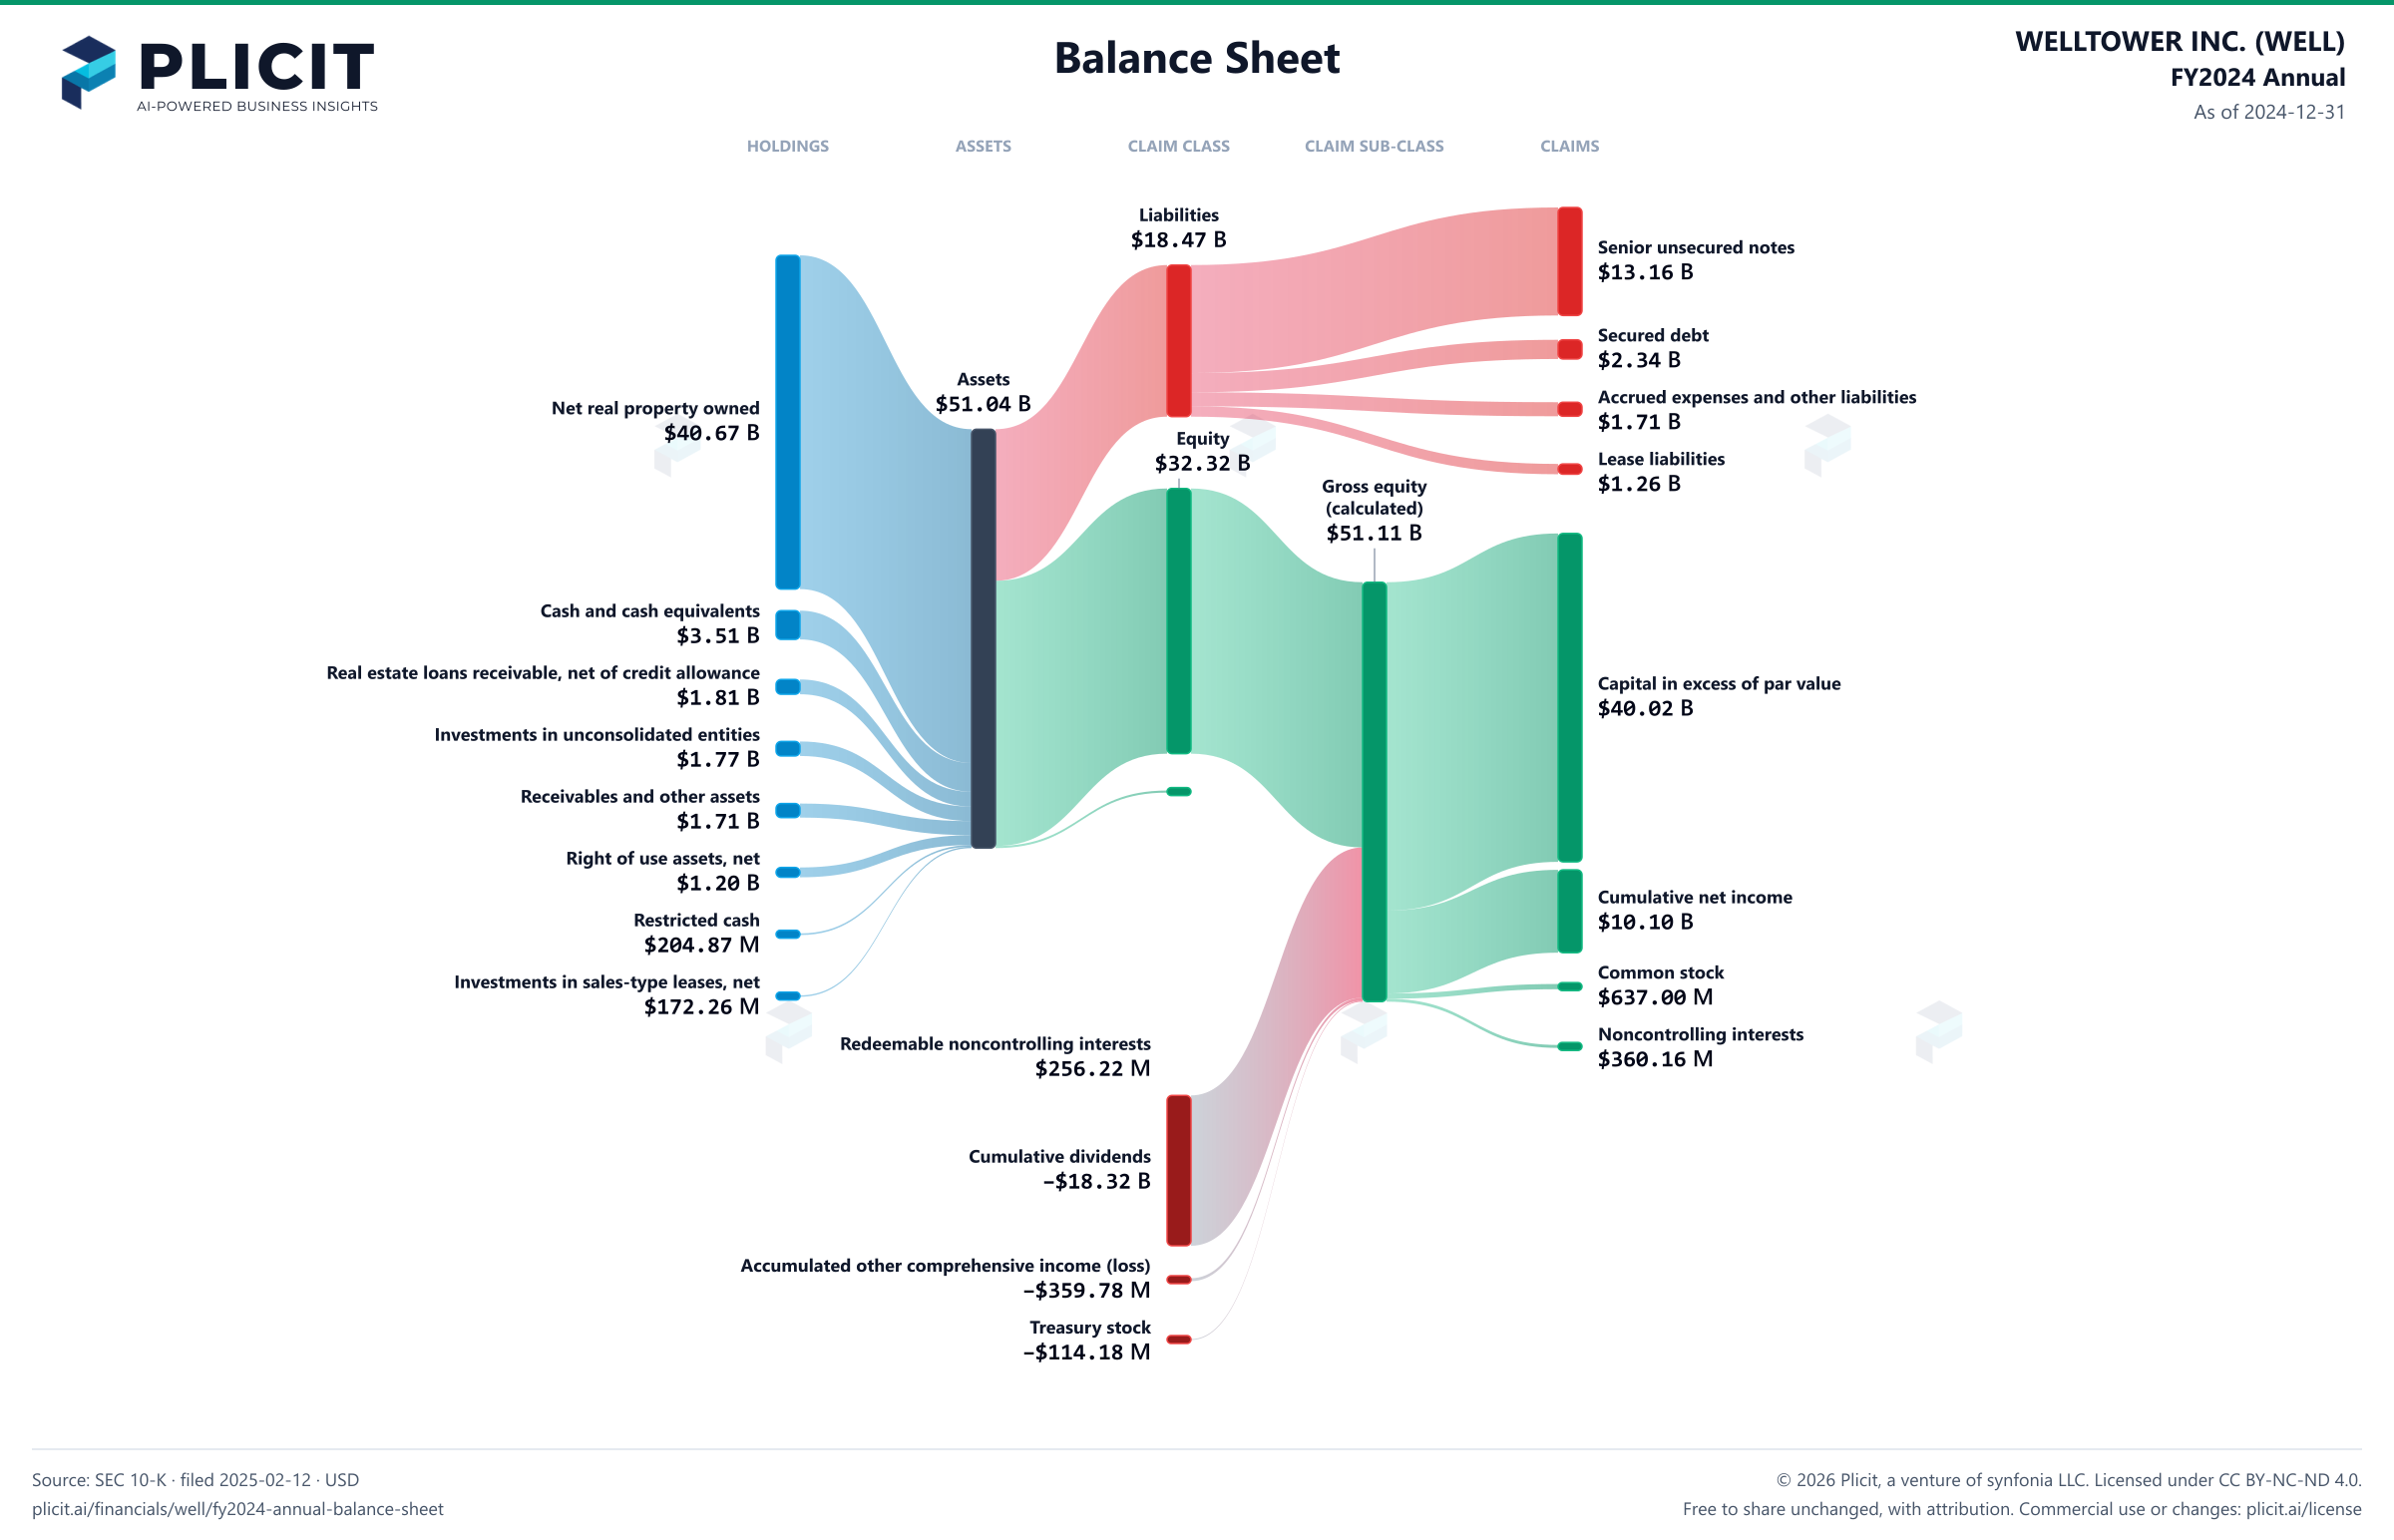
Balance sheet as of 2024-12-31. The chart shows assets, liabilities and equity at that date.
- Assets
- 51,044,308,000 US dollars
- Liabilities
- 18,471,722,000 US dollars
- Equity
- 32,316,366,000 US dollars
- Redeemable noncontrolling interests
- 256,220,000 US dollars
- Noncontrolling interest
- 360,158,000 US dollars. Included in consolidated equity; this amount is not added again.
- Construction in progress
- 1,219,720,000 US dollars. Part of Net real property owned, drawn as one net amount.
- Acquired lease intangibles
- 2,548,766,000 US dollars. Part of Net real property owned, drawn as one net amount.
- Less accumulated depreciation and amortization
- negative 10,626,263,000 US dollars. Part of Net real property owned, drawn as one net amount.
- Land and land improvements
- 5,271,418,000 US dollars. Part of Net real property owned, drawn as one net amount.
- Buildings and improvements
- 42,207,735,000 US dollars. Part of Net real property owned, drawn as one net amount.
- Real property held for sale, net of accumulated depreciation
- 51,866,000 US dollars. Part of Net real property owned, drawn as one net amount.
- Net real property owned
- 40,673,242,000 US dollars
- Cash and cash equivalents
- 3,506,586,000 US dollars
- Real estate loans receivable, net of credit allowance
- 1,805,044,000 US dollars
- Investments in unconsolidated entities
- 1,768,772,000 US dollars
- Receivables and other assets
- 1,712,402,000 US dollars
- Right of use assets, net
- 1,201,131,000 US dollars
- Restricted cash
- 204,871,000 US dollars
- Investments in sales-type leases, net
- 172,260,000 US dollars
- Senior unsecured notes
- 13,162,102,000 US dollars
- Secured debt
- 2,338,155,000 US dollars
- Accrued expenses and other liabilities
- 1,713,366,000 US dollars
- Lease liabilities
- 1,258,099,000 US dollars
- Unsecured credit facility and commercial paper
- 0 US dollars
- Capital in excess of par value
- 40,016,503,000 US dollars
- Cumulative net income
- 10,096,724,000 US dollars
- Common stock
- 637,002,000 US dollars
- Noncontrolling interests
- 360,158,000 US dollars
- Cumulative dividends
- negative 18,320,064,000 US dollars
- Accumulated other comprehensive income (loss)
- negative 359,781,000 US dollars
- Treasury stock
- negative 114,176,000 US dollars
- Gross equity (calculated)
- 51,110,387,000 US dollars. Net equity plus the magnitudes of its negative contributions equals gross positive equity. The negative contributions enter this reconciliation as add-backs; their filed signs stay negative.
Chart connections
- Assets equal liabilities plus temporary equity plus consolidated equity. Consolidated equity includes noncontrolling interests when reported.
- Treasury shares and other negative equity contributions reduce equity.
Free to share unchanged, with credit to Plicit.ai · CC BY-NC-ND 4.0Download PNG
Product waitlist
Health Check and Teardown for your own company
A health check uncovers insights of your private books, not a public ticker. Join this list to get notified as soon as we go-live!