
WEX Inc. (WEX) FY2026 Q3 P&L / Income Statement

Published Source: Form 10-Q on SEC EDGAR filed (opens in a new tab)

2026-07-01 to 2026-09-30

Revenue by Business Segment by Product and Service

Swipe to see the full flow
WEX Inc. (WEX) FY2026 Q3 P&L / Income StatementIncome statement for 2026-07-01 through 2026-09-30. View: Segments by Product and Service. Revenue uses this breakdown; costs and expenses retain the consolidated categories.SOURCESREVENUEGROSSOPERATINGPRE-TAXNETMobility - Payment processing revenueMobility - Finance fee revenueCorporate Payments - Payment processing revenueBenefits - Account servicing revenueBenefits - Other revenueMobility - Account servicing revenueMobility - Other revenueBenefits - Payment processing revenueCorporate Payments - Account servicing revenueCorporate Payments - Other revenueBenefits - Finance fee revenueCorporate Payments - Finance fee revenueTotal revenuesGross profit (calculated)Total cost of servicesOperating incomeOperating expenses (calculated)Sales and marketingGeneral and administrativeDepreciation and amortizationIncome before income taxesOther income (expense), net (calculated)Net income attributable to shareholdersIncome tax expenseGross profit (calculated)Gross profit(calculated)$492.70 MTotal revenuesTotal revenues$780.10 MOperating incomeOperating income$238.80 MIncome before income taxesPretax income$185.50 MNet income attributable to shareholdersNet income attributableto shareholders$134.10 MMobility - Payment processing revenueMobility - Paymentprocessing revenue$205.40 MMobility - Finance fee revenueMobility - Finance fee revenue$115.70 MOperating expenses (calculated)Operating expenses(calculated)$253.90 MIncome tax expenseIncome tax expense$51.40 MCorporate Payments - Payment processing revenueCorporate Payments -Payment processing revenue$113.60 MSales and marketingSales and marketing$109.30 MOther income (expense), net (calculated)Other income,net (calculated)−$53.30 MTotal cost of servicesTotal cost of services$287.40 MGeneral and administrativeGeneral and administrative$100.70 MBenefits - Account servicing revenueBenefits - Account servicing revenue$110.20 MDepreciation and amortizationDepreciation and amortization$43.90 MBenefits - Other revenueBenefits - Other revenue$71.50 MMobility - Account servicing revenueMobility - Account servicing revenue$57.10 MMobility - Other revenueMobility - Other revenue$56.90 MBenefits - Payment processing revenueBenefits - Paymentprocessing revenue$25.80 MCorporate Payments - Account servicing revenueCorporate Payments -Account servicing revenue$19.40 MCorporate Payments - Other revenueCorporate Payments - Other revenue$4.30 MBenefits - Finance fee revenueBenefits - Finance fee revenue$100.00 KCorporate Payments - Finance fee revenueCorporate Payments -Finance fee revenue$100.00 K
Chart details

WEX Inc. (WEX) FY2026 Q3 P&L / Income Statement

Income statement for 2026-07-01 through 2026-09-30. View: Segments by Product and Service. Revenue uses this breakdown; costs and expenses retain the consolidated categories.

Total revenues
780,100,000 US dollars
Total cost of services
287,400,000 US dollars
Gross profit (calculated)
492,700,000 US dollars
Operating expenses (calculated)
253,900,000 US dollars
Operating income
238,800,000 US dollars
Other income (expense), net (calculated)
negative 53,300,000 US dollars
Income before income taxes
185,500,000 US dollars
Income tax expense
51,400,000 US dollars
Net income attributable to shareholders
134,100,000 US dollars
Benefits - Other revenue
71,500,000 US dollars
Benefits - Account servicing revenue
110,200,000 US dollars
Benefits - Finance fee revenue
100,000 US dollars
Benefits - Payment processing revenue
25,800,000 US dollars
Corporate Payments - Other revenue
4,300,000 US dollars
Corporate Payments - Account servicing revenue
19,400,000 US dollars
Corporate Payments - Finance fee revenue
100,000 US dollars
Corporate Payments - Payment processing revenue
113,600,000 US dollars
Mobility - Other revenue
56,900,000 US dollars
Mobility - Account servicing revenue
57,100,000 US dollars
Mobility - Finance fee revenue
115,700,000 US dollars
Mobility - Payment processing revenue
205,400,000 US dollars
Sales and marketing
109,300,000 US dollars
General and administrative
100,700,000 US dollars
Depreciation and amortization
43,900,000 US dollars

Chart connections

  • Revenue less cost of revenue equals gross profit; gross profit less operating expenses equals operating income.
  • Operating income plus other income or expense equals income before tax. Income before tax less income tax expense or benefit equals net income.
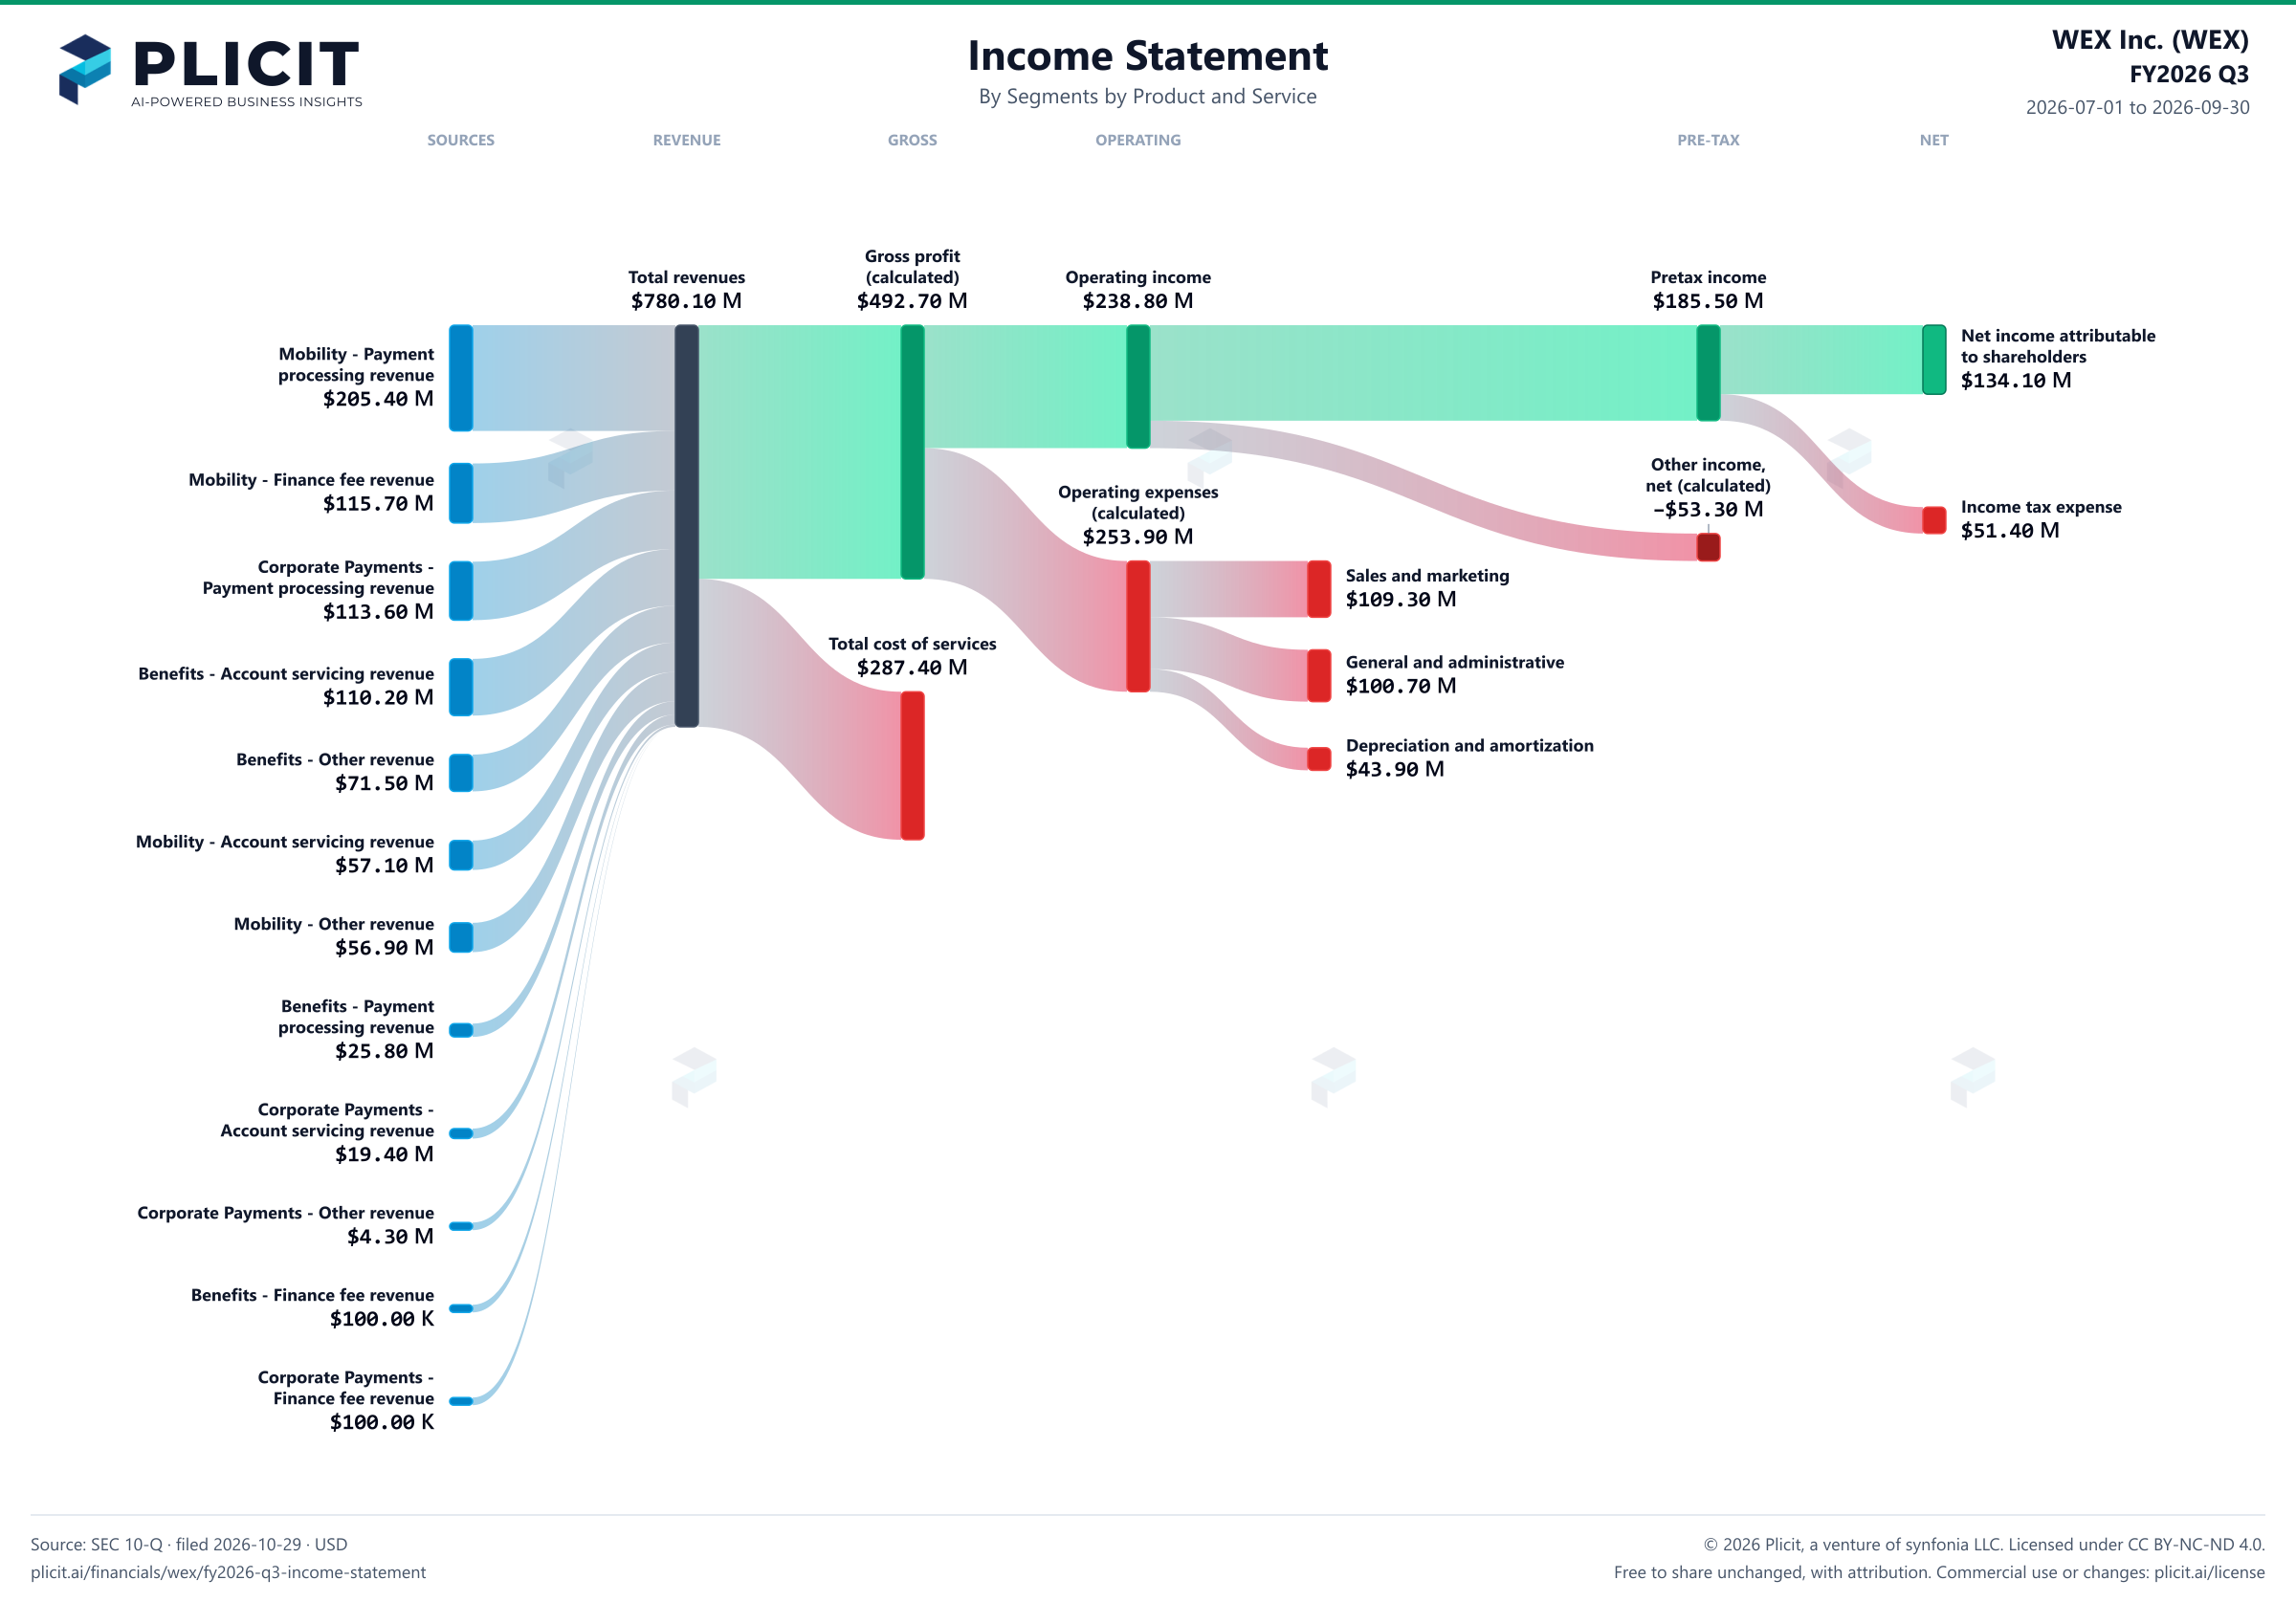
WEX Inc. (WEX) FY2026 Q3 Revenue by Business Segment by Product and Service Sankey chart
Free to share unchanged, with credit to Plicit.ai · CC BY-NC-ND 4.0Download PNG

Product waitlist

Health Check and Teardown for your own company

A health check uncovers insights of your private books, not a public ticker. Join this list to get notified as soon as we go-live!