
Abbott Laboratories (ABT) FY2024 Annual Balance Sheet
As of 2024-12-31
Balance Sheet
As of 2024-12-31
Swipe to see the full flow
Chart details
Abbott Laboratories (ABT) FY2024 Annual Balance Sheet
Balance sheet as of 2024-12-31. The chart shows assets, liabilities and equity at that date.
- Assets
- 81,414,000,000 US dollars
- Current assets
- 23,656,000,000 US dollars
- Non-current assets
- 57,758,000,000 US dollars
- Liabilities (calculated)
- 33,513,000,000 US dollars
- Current liabilities
- 14,157,000,000 US dollars
- Non-current liabilities
- 19,356,000,000 US dollars
- Equity
- 47,901,000,000 US dollars
- Noncontrolling interest
- 237,000,000 US dollars. Included in consolidated equity; this amount is not added again.
- Land
- 528,000,000 US dollars. Part of Net property and equipment, drawn as one net amount.
- Buildings
- 4,207,000,000 US dollars. Part of Net property and equipment, drawn as one net amount.
- Equipment
- 15,517,000,000 US dollars. Part of Net property and equipment, drawn as one net amount.
- Construction in progress
- 2,488,000,000 US dollars. Part of Net property and equipment, drawn as one net amount.
- Less: accumulated depreciation and amortization
- negative 12,082,000,000 US dollars. Part of Net property and equipment, drawn as one net amount.
- Cash and cash equivalents
- 7,616,000,000 US dollars
- Trade receivables, less allowances of — 2024: $439; 2023: $444
- 6,925,000,000 US dollars
- Finished products
- 3,700,000,000 US dollars
- Other prepaid expenses and receivables
- 2,570,000,000 US dollars
- Materials
- 1,654,000,000 US dollars
- Work in process
- 840,000,000 US dollars
- Investments, primarily bank time deposits and U.S. treasury bills
- 351,000,000 US dollars
- Goodwill
- 23,108,000,000 US dollars
- Deferred income taxes and other assets
- 16,459,000,000 US dollars
- Net property and equipment
- 10,658,000,000 US dollars
- Intangible assets, net of amortization
- 6,647,000,000 US dollars
- Investments
- 886,000,000 US dollars
- Other accrued liabilities
- 5,143,000,000 US dollars
- Trade accounts payable
- 4,195,000,000 US dollars
- Salaries, wages and commissions
- 1,701,000,000 US dollars
- Current portion of long-term debt
- 1,500,000,000 US dollars
- Dividends payable
- 1,024,000,000 US dollars
- Income taxes payable
- 594,000,000 US dollars
- Long-term debt
- 12,625,000,000 US dollars
- Post-employment obligations and other long-term liabilities
- 6,731,000,000 US dollars
- Earnings employed in the business
- 47,261,000,000 US dollars
- Common shares, without par value Authorized — 2,400,000,000 shares Issued at stated capital amount — Shares: 2024: 1,991,472,630; 2023: 1,987,883,852
- 25,153,000,000 US dollars
- Preferred shares, one dollar par value Authorized — 1,000,000 shares, none issued
- 0 US dollars
- Noncontrolling interests in subsidiaries
- 237,000,000 US dollars
- Common shares held in treasury, at cost — Shares: 2024: 259,774,639; 2023: 253,807,494
- negative 16,844,000,000 US dollars
- Accumulated other comprehensive income (loss)
- negative 7,906,000,000 US dollars
- Gross equity (calculated)
- 72,651,000,000 US dollars. Net equity plus the magnitudes of its negative contributions equals gross positive equity. The negative contributions enter this reconciliation as add-backs; their filed signs stay negative.
Chart connections
- Assets equal liabilities plus consolidated equity. Consolidated equity includes noncontrolling interests when reported.
- Treasury shares and other negative equity contributions reduce equity.
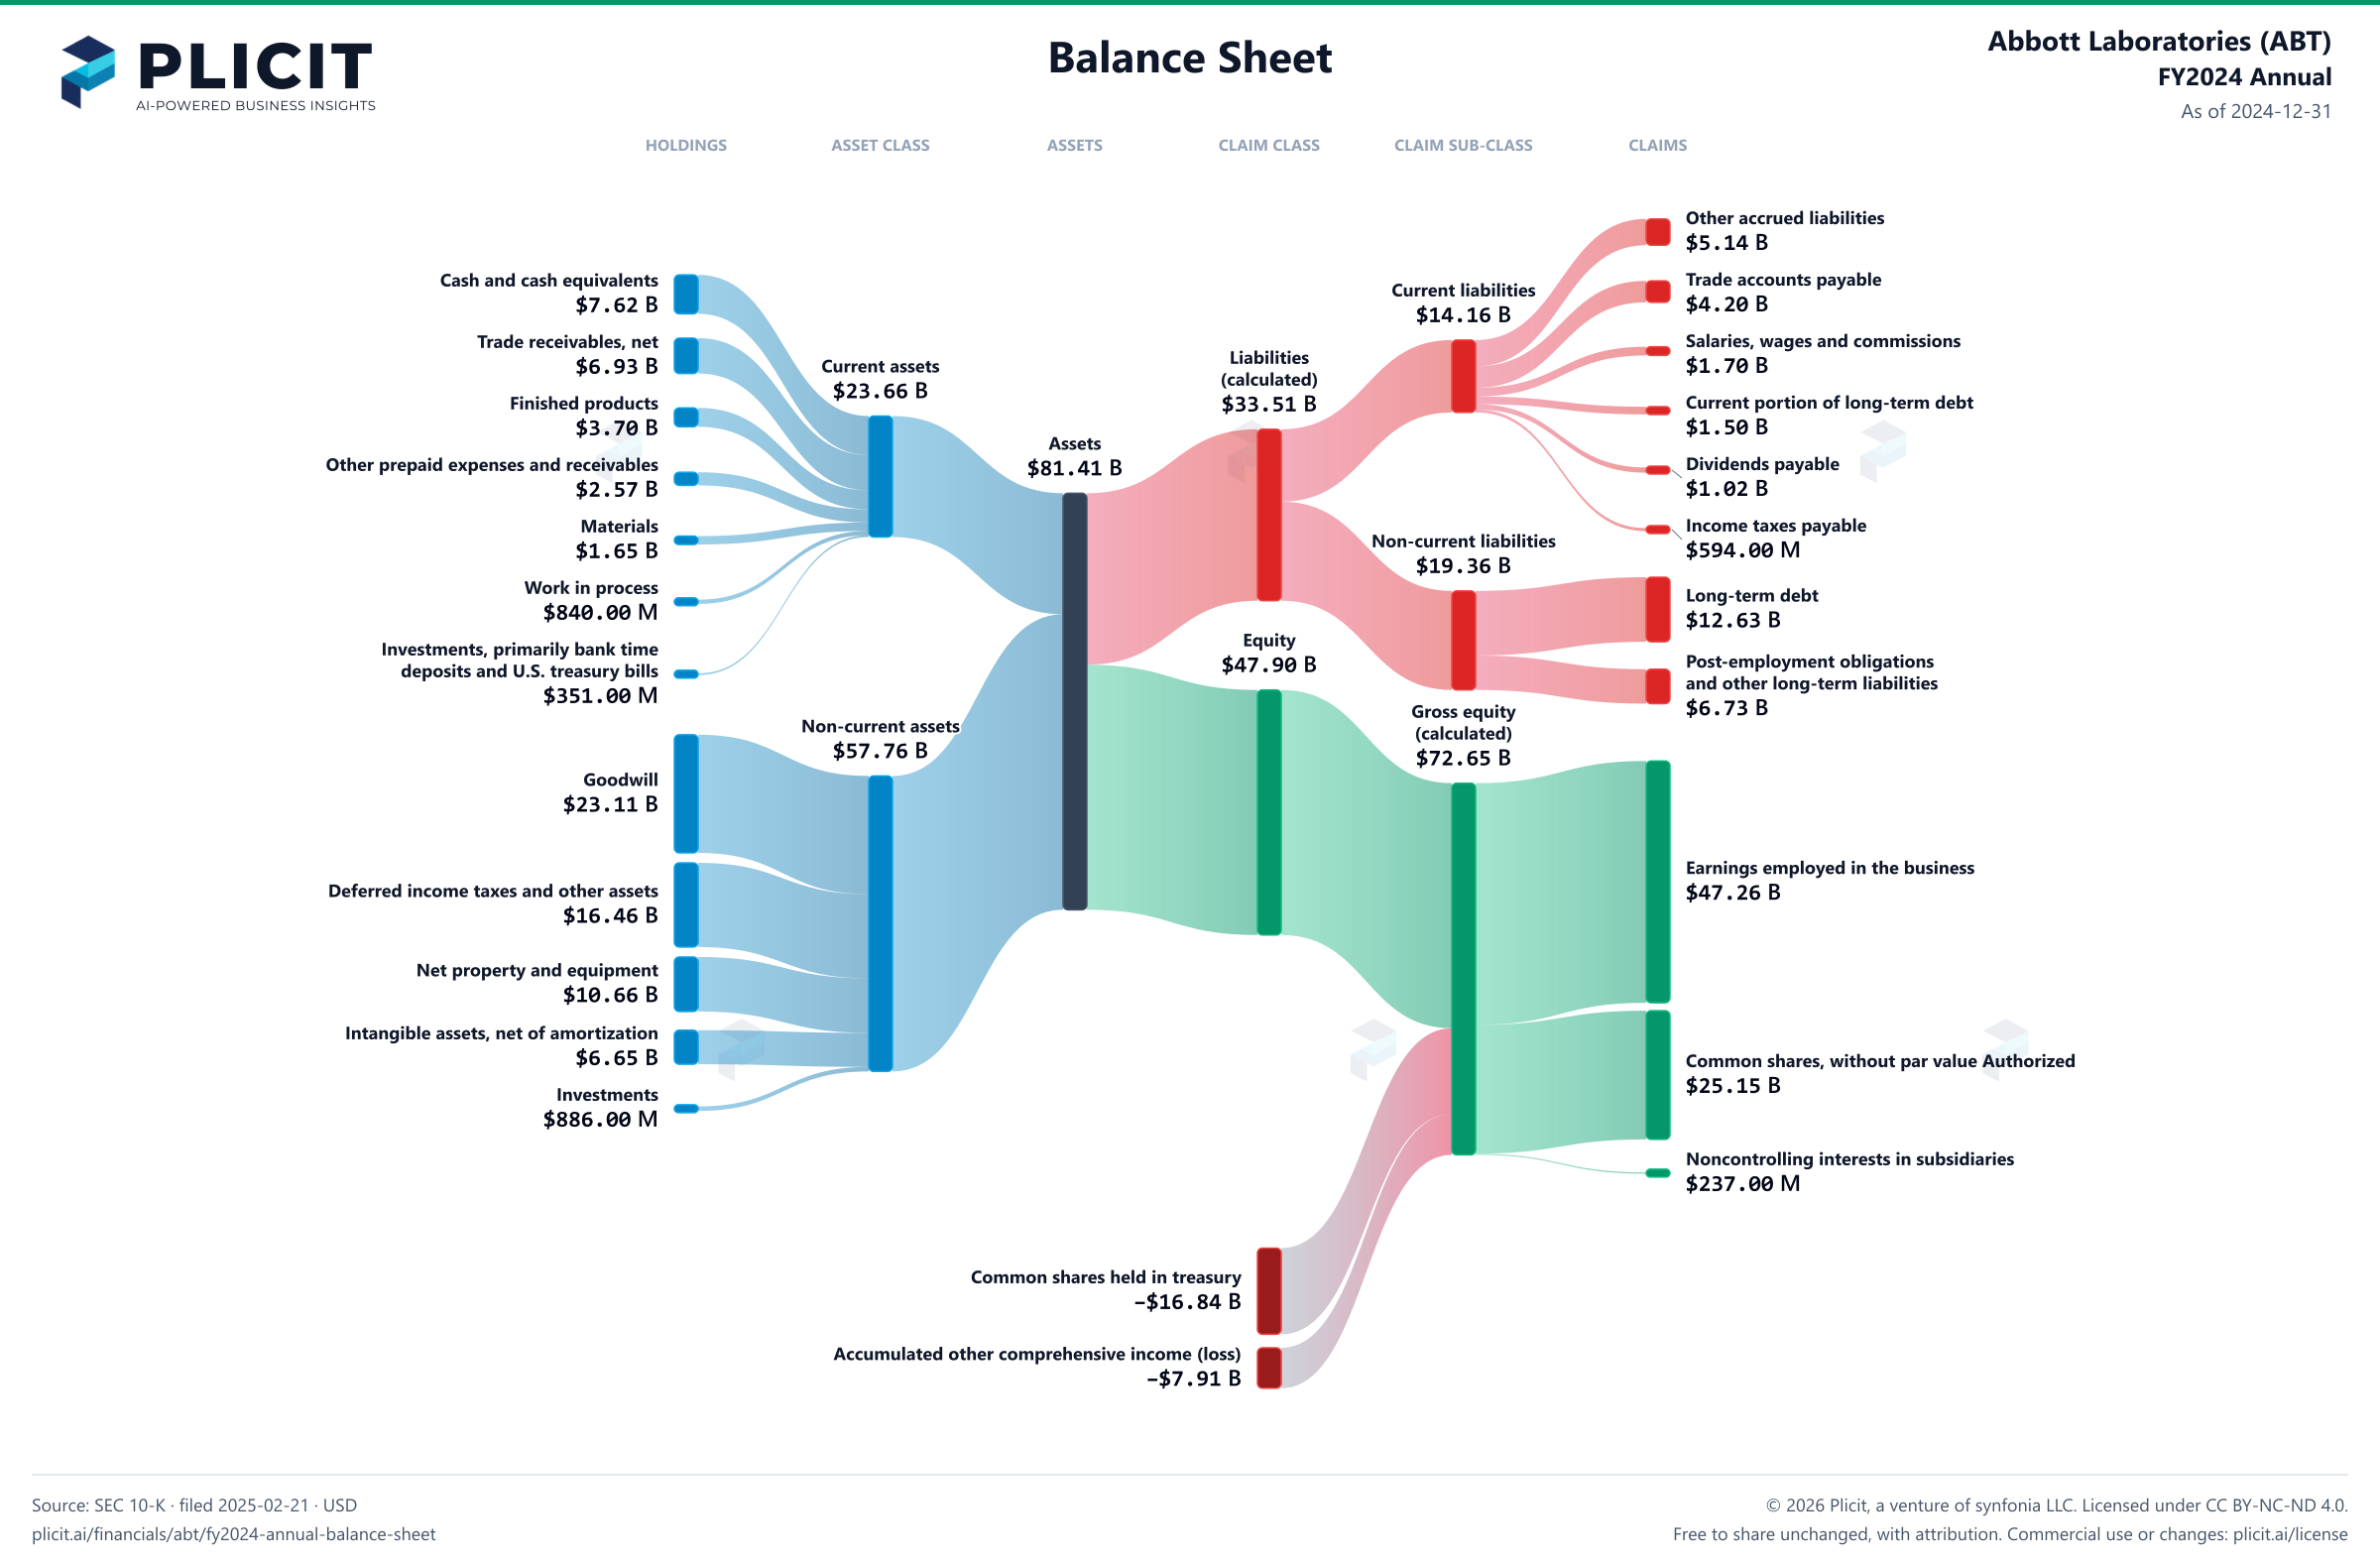
Free to share unchanged, with credit to Plicit.ai · CC BY-NC-ND 4.0Download PNG
Product waitlist
Health Check and Teardown for your own company
A health check uncovers insights of your private books, not a public ticker. Join this list to get notified as soon as we go-live!