
ABBOTT LABORATORIES (ABT) FY2026 Q2 Balance Sheet

Balance Sheet

As of 2026-06-30

Swipe to see the full flow
ABBOTT LABORATORIES (ABT) FY2026 Q2 Balance SheetBalance sheet as of 2026-06-30. The chart shows assets, liabilities and equity at that date.Current liabilities$17.81 BLiabilities(calculated)$57.45 BCurrent assets$24.52 BAssets$109.22 BNon-current liabilities$39.64 BNon-current assets$84.70 BEquity$51.76 BGross equity(calculated)$75.94 BHOLDINGSASSET CLASSASSETSCLAIM CLASSCLAIM SUB-CLASSCLAIMSTrade receivables, less allowances of $486 in 2026 and $490 in 2025Cash and cash equivalentsFinished productsPrepaid expenses and other receivablesMaterialsWork in processShort-term investmentsGoodwillDeferred income taxes and other assetsIntangible assets, net of amortizationNet property and equipmentInvestmentsOther accrued liabilitiesTrade accounts payableCurrent portion of long-term debtSalaries, wages, and commissionsDividends payableIncome taxes payableLong-term debtPost-employment obligations, deferred income taxes, and other long-term liabilitiesEarnings employed in the businessCommon shares, without par value Authorized — 2,400,000,000 shares Issued at stated capital amount — Shares: 2026: 1,998,291,279; 2025: 1,996,795,525Noncontrolling interestsCurrent assetsNon-current assetsAssetsCurrent liabilitiesNon-current liabilitiesLiabilities (calculated)EquityGross equity (calculated)Common shares held in treasury, at cost — Shares: 2026: 267,907,258; 2025: 260,196,074Accumulated other comprehensive income (loss)Other accrued liabilitiesOther accrued liabilities$6.89 BTrade receivables, less allowances of $486 in 2026 and $490 in 2025Trade receivables, net$8.60 BTrade accounts payableTrade accounts payable$4.79 BCurrent liabilitiesCurrent liabilities$17.81 BCash and cash equivalentsCash and cash equivalents$5.10 BCurrent portion of long-term debtCurrent portion of long-term debt$3.01 BLiabilities (calculated)Liabilities(calculated)$57.45 BCurrent assetsCurrent assets$24.52 BFinished productsFinished products$4.51 BSalaries, wages, and commissionsSalaries, wages, and commissions$1.62 BAssetsAssets$109.22 BPrepaid expenses and other receivablesPrepaid expenses and other receivables$3.00 BDividends payableDividends payable$1.09 BMaterialsMaterials$1.78 BIncome taxes payableIncome taxes payable$411.00 MNon-current liabilitiesNon-current liabilities$39.64 BWork in processWork in process$1.02 BLong-term debtLong-term debt$29.60 BShort-term investmentsShort-term investments$499.00 MNon-current assetsNon-current assets$84.70 BEquityEquity$51.76 BPost-employment obligations, deferred income taxes, and other long-term liabilitiesPost-employment obligations, deferredincome taxes, and other long-term liabilities$10.04 BGoodwillGoodwill$35.24 BGross equity (calculated)Gross equity(calculated)$75.94 BDeferred income taxes and other assetsDeferred income taxes and other assets$18.32 BEarnings employed in the businessEarnings employed in the business$49.79 BIntangible assets, net of amortizationIntangible assets, net of amortization$17.21 BNet property and equipmentNet property and equipment$12.81 BCommon shares, without par value Authorized — 2,400,000,000 shares Issued at stated capital amount — Shares: 2026: 1,998,291,279; 2025: 1,996,795,525Common shares, without par value Authorized$25.50 BInvestmentsInvestments$1.11 BNoncontrolling interestsNoncontrolling interests$652.00 MCommon shares held in treasury, at cost — Shares: 2026: 267,907,258; 2025: 260,196,074Common shares held in treasury−$17.97 BAccumulated other comprehensive income (loss)Accumulated other comprehensive income (loss)−$6.21 B
Chart details

ABBOTT LABORATORIES (ABT) FY2026 Q2 Balance Sheet

Balance sheet as of 2026-06-30. The chart shows assets, liabilities and equity at that date.

Assets
109,215,000,000 US dollars
Current assets
24,517,000,000 US dollars
Non-current assets
84,698,000,000 US dollars
Liabilities (calculated)
57,453,000,000 US dollars
Current liabilities
17,814,000,000 US dollars
Non-current liabilities
39,639,000,000 US dollars
Equity
51,762,000,000 US dollars
Noncontrolling interest
652,000,000 US dollars. Included in consolidated equity; this amount is not added again.
Property and equipment, at cost
26,469,000,000 US dollars. Part of Net property and equipment, drawn as one net amount.
Less: accumulated depreciation and amortization
negative 13,657,000,000 US dollars. Part of Net property and equipment, drawn as one net amount.
Trade receivables, less allowances of $486 in 2026 and $490 in 2025
8,599,000,000 US dollars
Cash and cash equivalents
5,104,000,000 US dollars
Finished products
4,512,000,000 US dollars
Prepaid expenses and other receivables
3,000,000,000 US dollars
Materials
1,780,000,000 US dollars
Work in process
1,023,000,000 US dollars
Short-term investments
499,000,000 US dollars
Goodwill
35,244,000,000 US dollars
Deferred income taxes and other assets
18,320,000,000 US dollars
Intangible assets, net of amortization
17,211,000,000 US dollars
Net property and equipment
12,812,000,000 US dollars
Investments
1,111,000,000 US dollars
Other accrued liabilities
6,892,000,000 US dollars
Trade accounts payable
4,794,000,000 US dollars
Current portion of long-term debt
3,005,000,000 US dollars
Salaries, wages, and commissions
1,619,000,000 US dollars
Dividends payable
1,093,000,000 US dollars
Income taxes payable
411,000,000 US dollars
Long-term debt
29,603,000,000 US dollars
Post-employment obligations, deferred income taxes, and other long-term liabilities
10,036,000,000 US dollars
Earnings employed in the business
49,794,000,000 US dollars
Common shares, without par value Authorized — 2,400,000,000 shares Issued at stated capital amount — Shares: 2026: 1,998,291,279; 2025: 1,996,795,525
25,495,000,000 US dollars
Preferred shares, one dollar par value Authorized — 1,000,000 shares, none issued
0 US dollars
Noncontrolling interests
652,000,000 US dollars
Common shares held in treasury, at cost — Shares: 2026: 267,907,258; 2025: 260,196,074
negative 17,967,000,000 US dollars
Accumulated other comprehensive income (loss)
negative 6,212,000,000 US dollars
Gross equity (calculated)
75,941,000,000 US dollars. Net equity plus the magnitudes of its negative contributions equals gross positive equity. The negative contributions enter this reconciliation as add-backs; their filed signs stay negative.

Chart connections

  • Assets equal liabilities plus consolidated equity. Consolidated equity includes noncontrolling interests when reported.
  • Treasury shares and other negative equity contributions reduce equity.
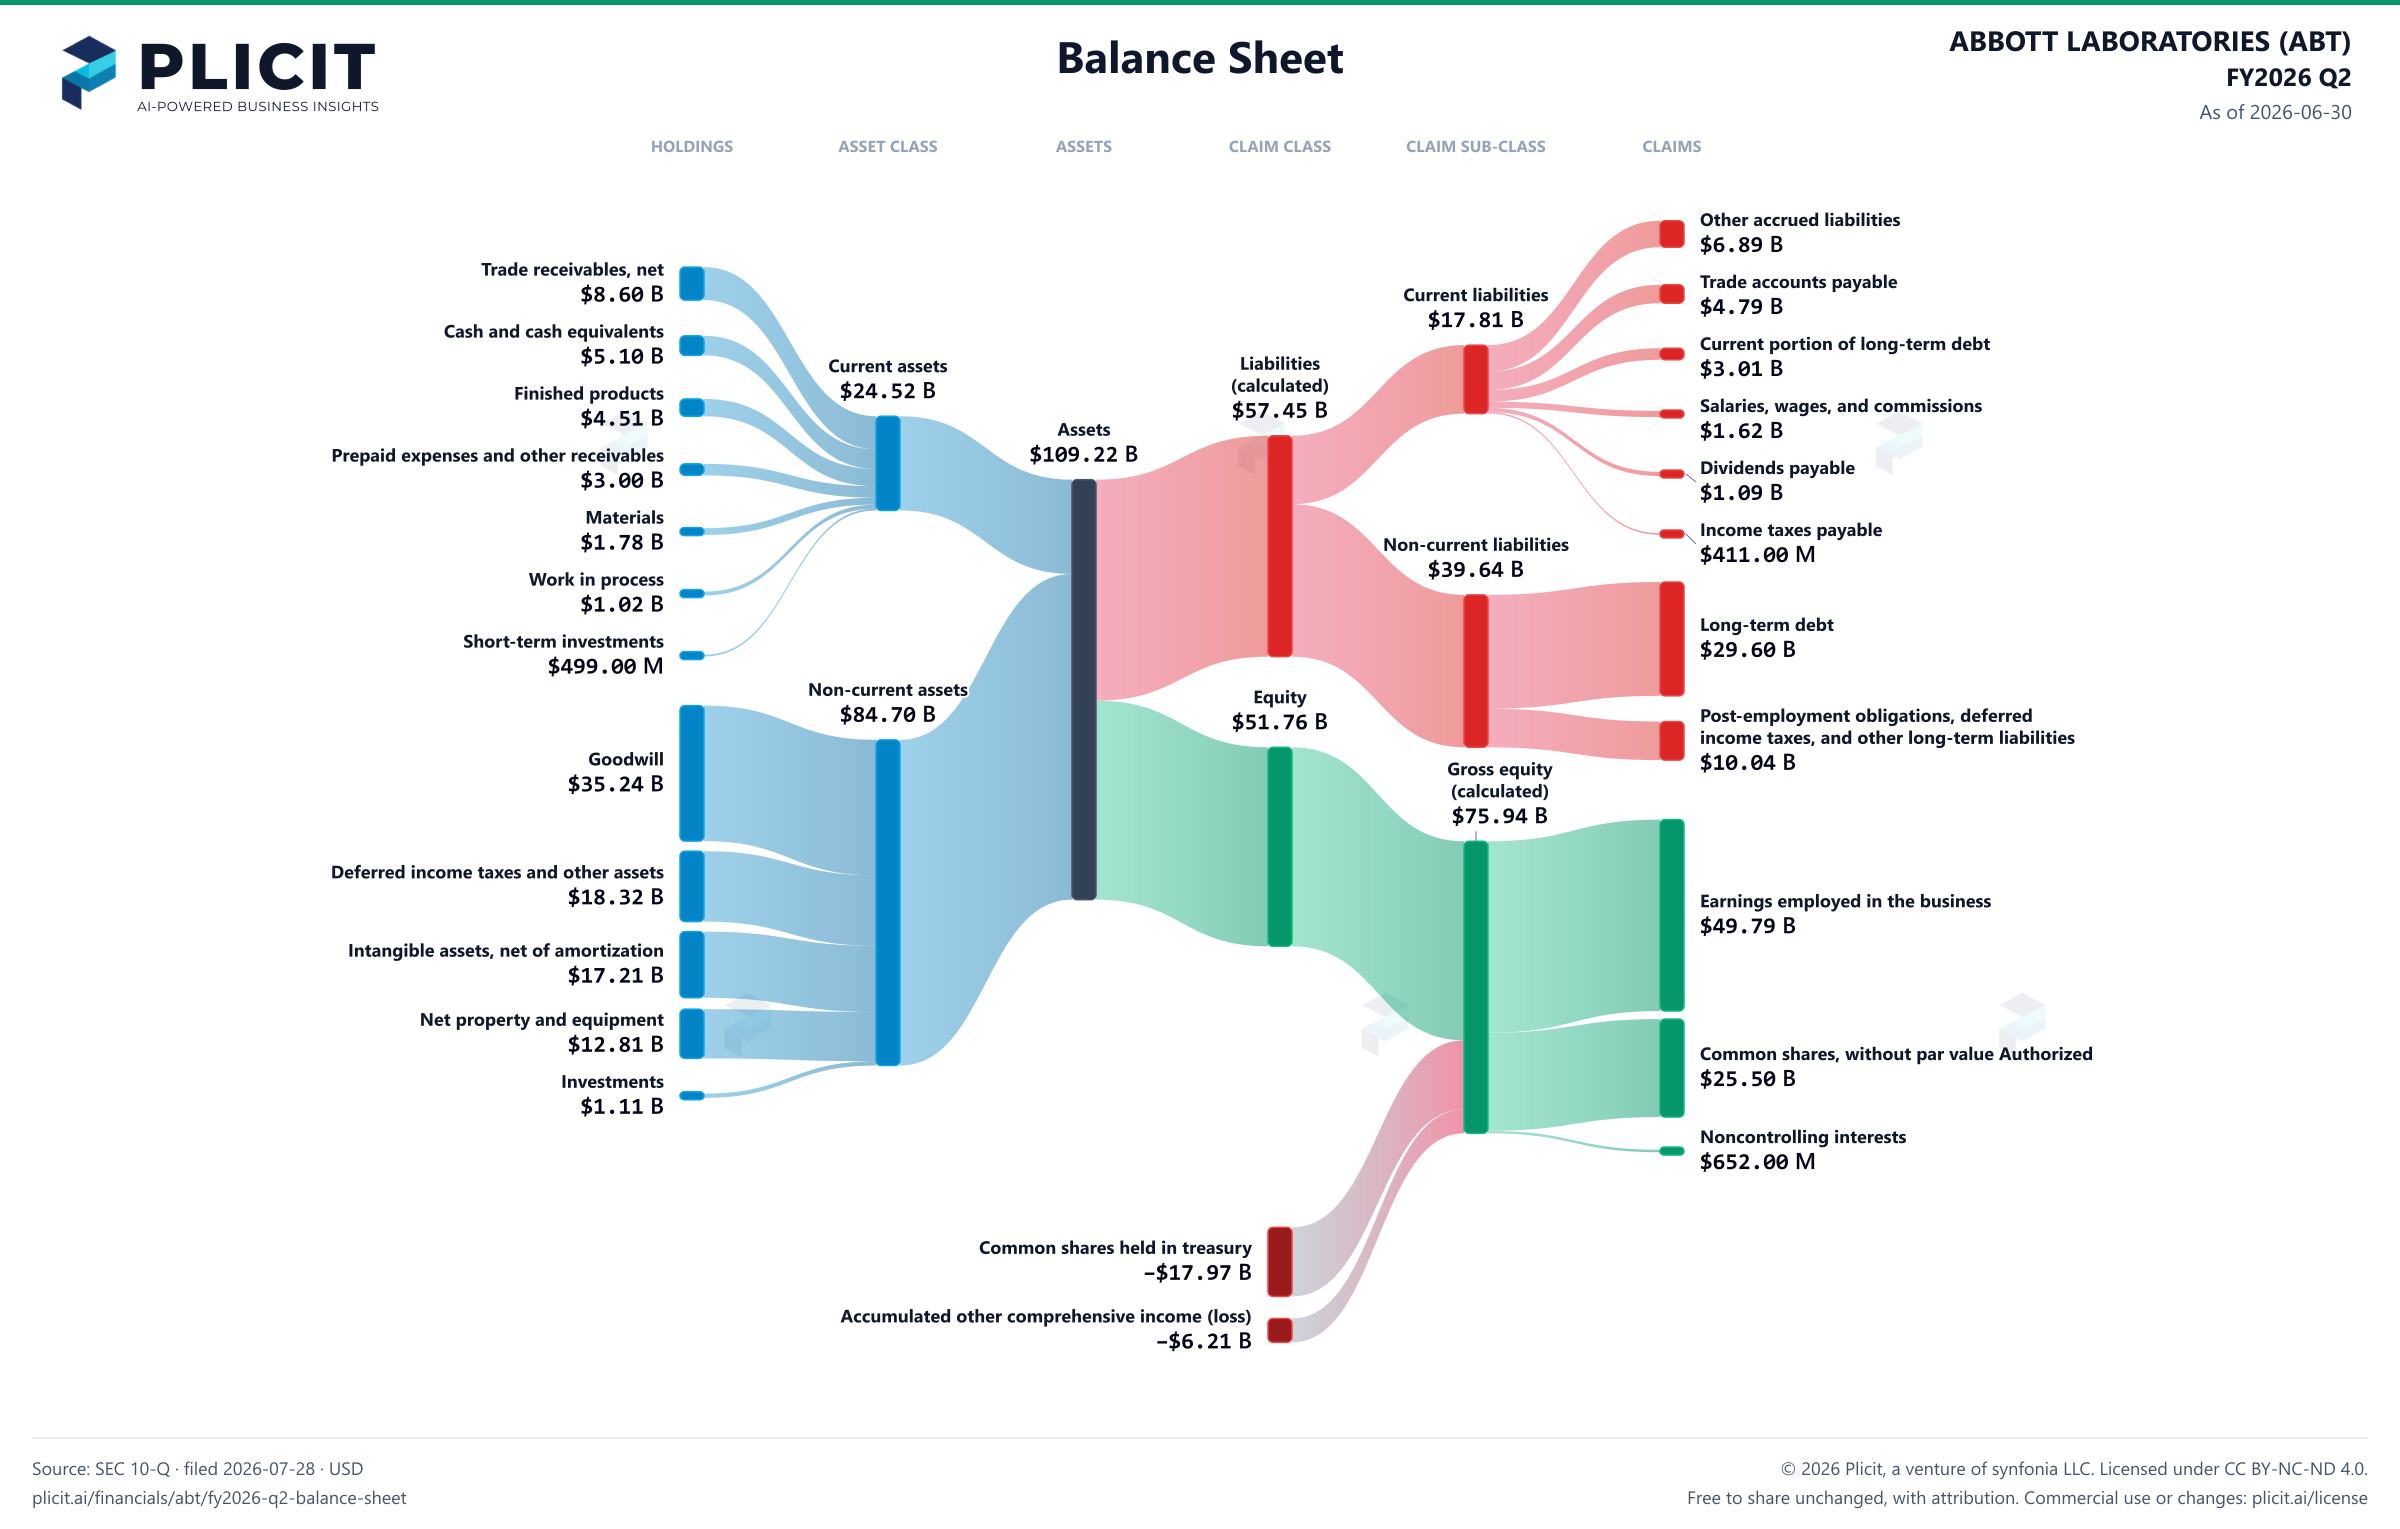
ABBOTT LABORATORIES (ABT) FY2026 Q2 Balance Sheet Sankey chart
Free to share unchanged, with credit to Plicit.ai · CC BY-NC-ND 4.0Download PNG

Newsletter

Get the teardowns by email

Subscribe if you want the public-company teardowns in your inbox when they're released.

Product waitlist

Health Check and Teardown for your own company

A health check uncovers insights of your private books, not a public ticker. Join this list to get notified as soon as we go-live!