
BridgeBio Pharma, Inc. (BBIO) FY2026 Q3 P&L / Income Statement

Published · Updated Source: Form 10-Q on SEC EDGAR filed (opens in a new tab)

Key Takeaways

  • The United States still brought in 72% of sales, against 90% a year earlier.
  • EMEA's share rose from 7.7% to 27.6%, and its dollars rose from $9.29 M to $97.48 M.
  • APAC fell 24% from a year earlier, while total revenue rose 193% as the company grew.
  • Its sales outside the home country reached 28%, up from 10% a year earlier.

The Unvarnished Truth

BridgeBio's US sales share fell from 90% to 72% in a year

Sales are concentrated in the United States: 72% of this quarter's $353.17 M, down from 90% a year earlier. The filing gives regions only as percentages, so the dollar figures on this page are estimates, each share times total sales. Only the percentages are reported; the dollars are our arithmetic on them. That matters because the EMEA slice rose from $9.29 M to $97.48 M, the fastest riser on the page. The filing does not give the regional dollar amounts.

Why did Europe, the Middle East and Africa jump? Its share went from 7.7% to 27.6% of sales, and the filing says revenue is attributed to regions by where customers or license partners are located. The quarter's $75.0 M sales milestone sits in the license line, which the filing ties to a Bayer agreement. If that milestone is attributed to a partner in the EMEA region, it would account for most of the $88.18 M rise there. The filing does not say where it was booked.

What it means: the regional story is thinner than the headline suggests. APAC slipped from $3.26 M to $2.47 M, down 24%, while the United States lost share. What would settle it is a regional table that shows where the milestone was booked and whether the percentages match the dollars. Until then, the regional dollars stay an estimate built on rounded shares, and the milestone's place in that picture stays unproven. Will the next filing break out the milestone by region?
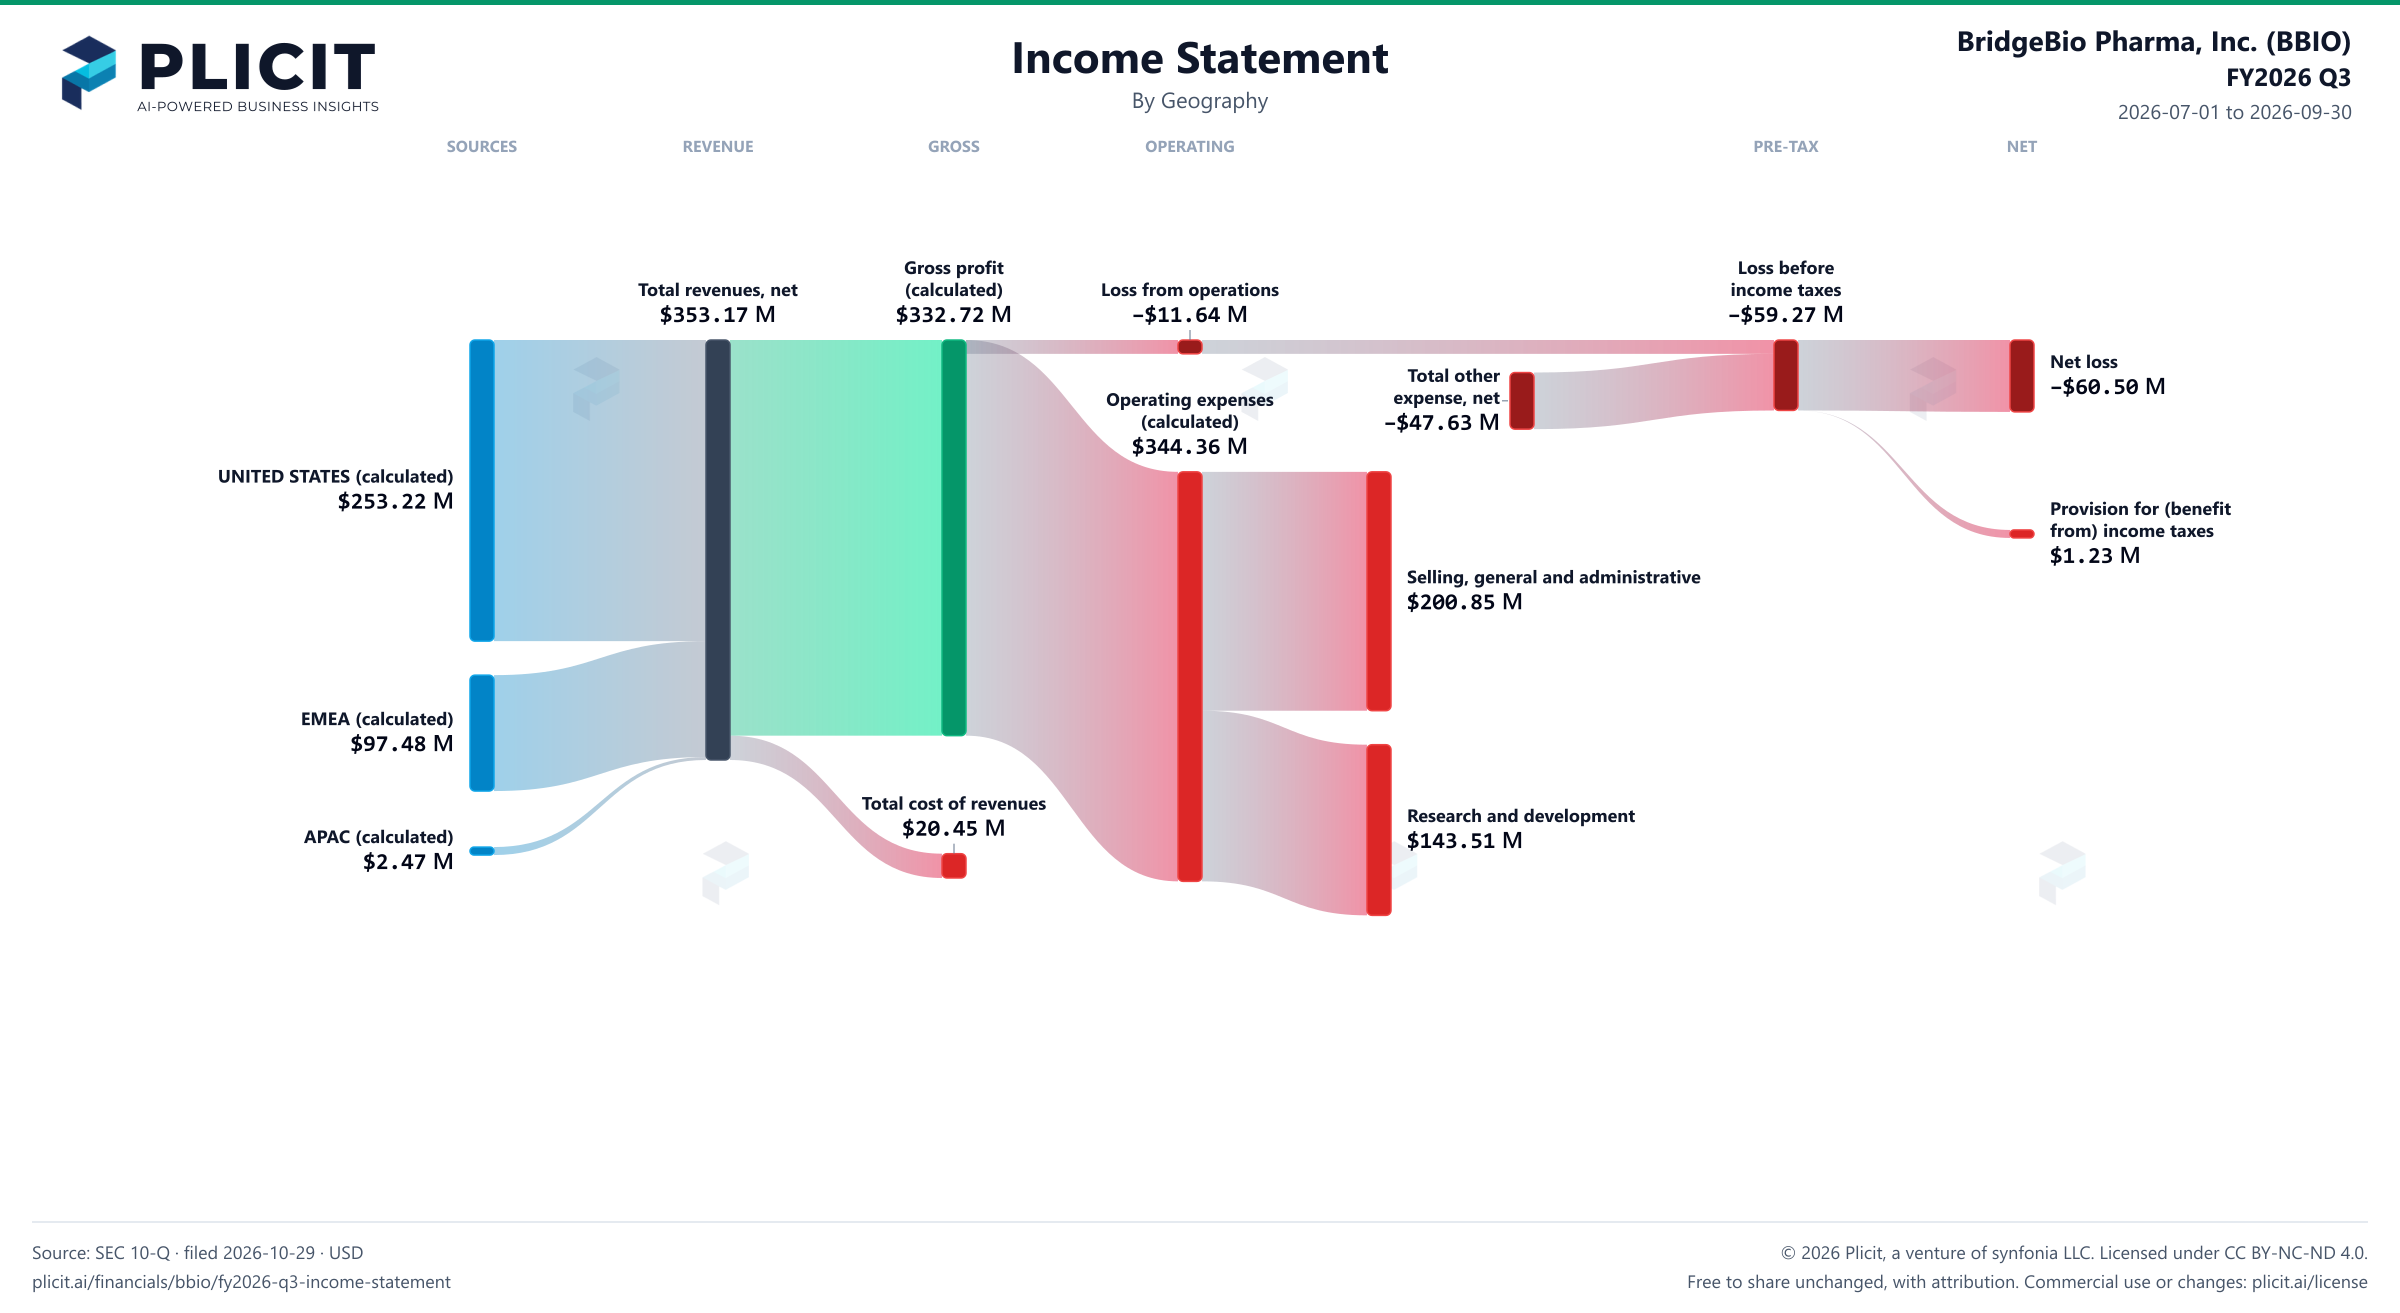
Revenue by Geography

Swipe to see the full flow
BridgeBio Pharma, Inc. (BBIO) FY2026 Q3 P&L / Income StatementIncome statement for 2026-07-01 through 2026-09-30. View: Geography. Revenue uses this breakdown; costs and expenses retain the consolidated categories.SOURCESREVENUEGROSSOPERATINGPRE-TAXNETUNITED STATES (calculated)EMEA (calculated)Asia Pacific (calculated)Total revenues, netGross profit (calculated)Total cost of revenuesLoss from operationsOperating expenses (calculated)Selling, general and administrativeResearch and developmentLoss before income taxesTotal other expense, netNet lossProvision for (benefit from) income taxesGross profit (calculated)Gross profit(calculated)$332.72 MLoss before income taxesLoss beforeincome taxes−$59.27 MTotal revenues, netTotal revenues, net$353.17 MLoss from operationsLoss from operations−$11.64 MNet lossNet loss−$60.50 MOperating expenses (calculated)Operating expenses(calculated)$344.36 MUNITED STATES (calculated)UNITED STATES (calculated)$253.22 MProvision for (benefit from) income taxesProvision for (benefitfrom) income taxes$1.23 MSelling, general and administrativeSelling, general and administrative$200.85 MEMEA (calculated)EMEA (calculated)$97.48 MTotal cost of revenuesTotal cost of revenues$20.45 MResearch and developmentResearch and development$143.51 MAsia Pacific (calculated)APAC (calculated)$2.47 MTotal other expense, netTotal otherexpense, net−$47.63 M
Chart details

BridgeBio Pharma, Inc. (BBIO) FY2026 Q3 P&L / Income Statement

Income statement for 2026-07-01 through 2026-09-30. View: Geography. Revenue uses this breakdown; costs and expenses retain the consolidated categories.

Total revenues, net
353,171,000 US dollars
Total cost of revenues
20,450,000 US dollars
Gross profit (calculated)
332,721,000 US dollars
Operating expenses (calculated)
344,360,000 US dollars
Loss from operations
negative 11,639,000 US dollars
Total other expense, net
negative 47,628,000 US dollars
Loss before income taxes
negative 59,267,000 US dollars
Provision for (benefit from) income taxes
1,229,000 US dollars
Net loss
negative 60,496,000 US dollars
UNITED STATES (calculated)
253,223,607 US dollars
Asia Pacific (calculated)
2,472,197 US dollars
EMEA (calculated)
97,475,196 US dollars
Restructuring, impairment, and related charges
0 US dollars
Research and development
143,506,000 US dollars
Selling, general and administrative
200,854,000 US dollars

Chart connections

  • Revenue less cost of revenue equals gross profit; gross profit less operating expenses equals operating income.
  • Operating income plus other income or expense equals income before tax. Income before tax less income tax expense or benefit equals net income.
  • Of which attributable to BridgeBio Pharma, Inc.: −$56.71 M; to noncontrolling interests: −$3.79 M.
BridgeBio Pharma, Inc. (BBIO) FY2026 Q3 Revenue by Geography Sankey chart
Free to share unchanged, with credit to Plicit.ai · CC BY-NC-ND 4.0Download PNG

Intelligent Insights for Investors

How much of BridgeBio's sales come from outside its home country?

Most of its sales are in the United States, but 28% came from abroad this quarter, against 10% a year earlier.

Which part of BridgeBio's sales by region lost the most ground over the past year?

APAC: its revenue fell 24% from a year earlier, while revenue as a whole rose 193%.

Intelligent Insights for Suppliers

How much does BridgeBio depend on the biggest piece of its sales by region?

Heavily: the United States brought in 72% of these sales this quarter, against 28% for EMEA, the next largest.

Product waitlist

Health Check and Teardown for your own company

A health check uncovers insights of your private books, not a public ticker. Join this list to get notified as soon as we go-live!