
CHUBB LIMITED (CB) FY2026 Q2 Balance Sheet
As of 2026-06-30
Balance Sheet
As of 2026-06-30
Swipe to see the full flow
Chart details
CHUBB LIMITED (CB) FY2026 Q2 Balance Sheet
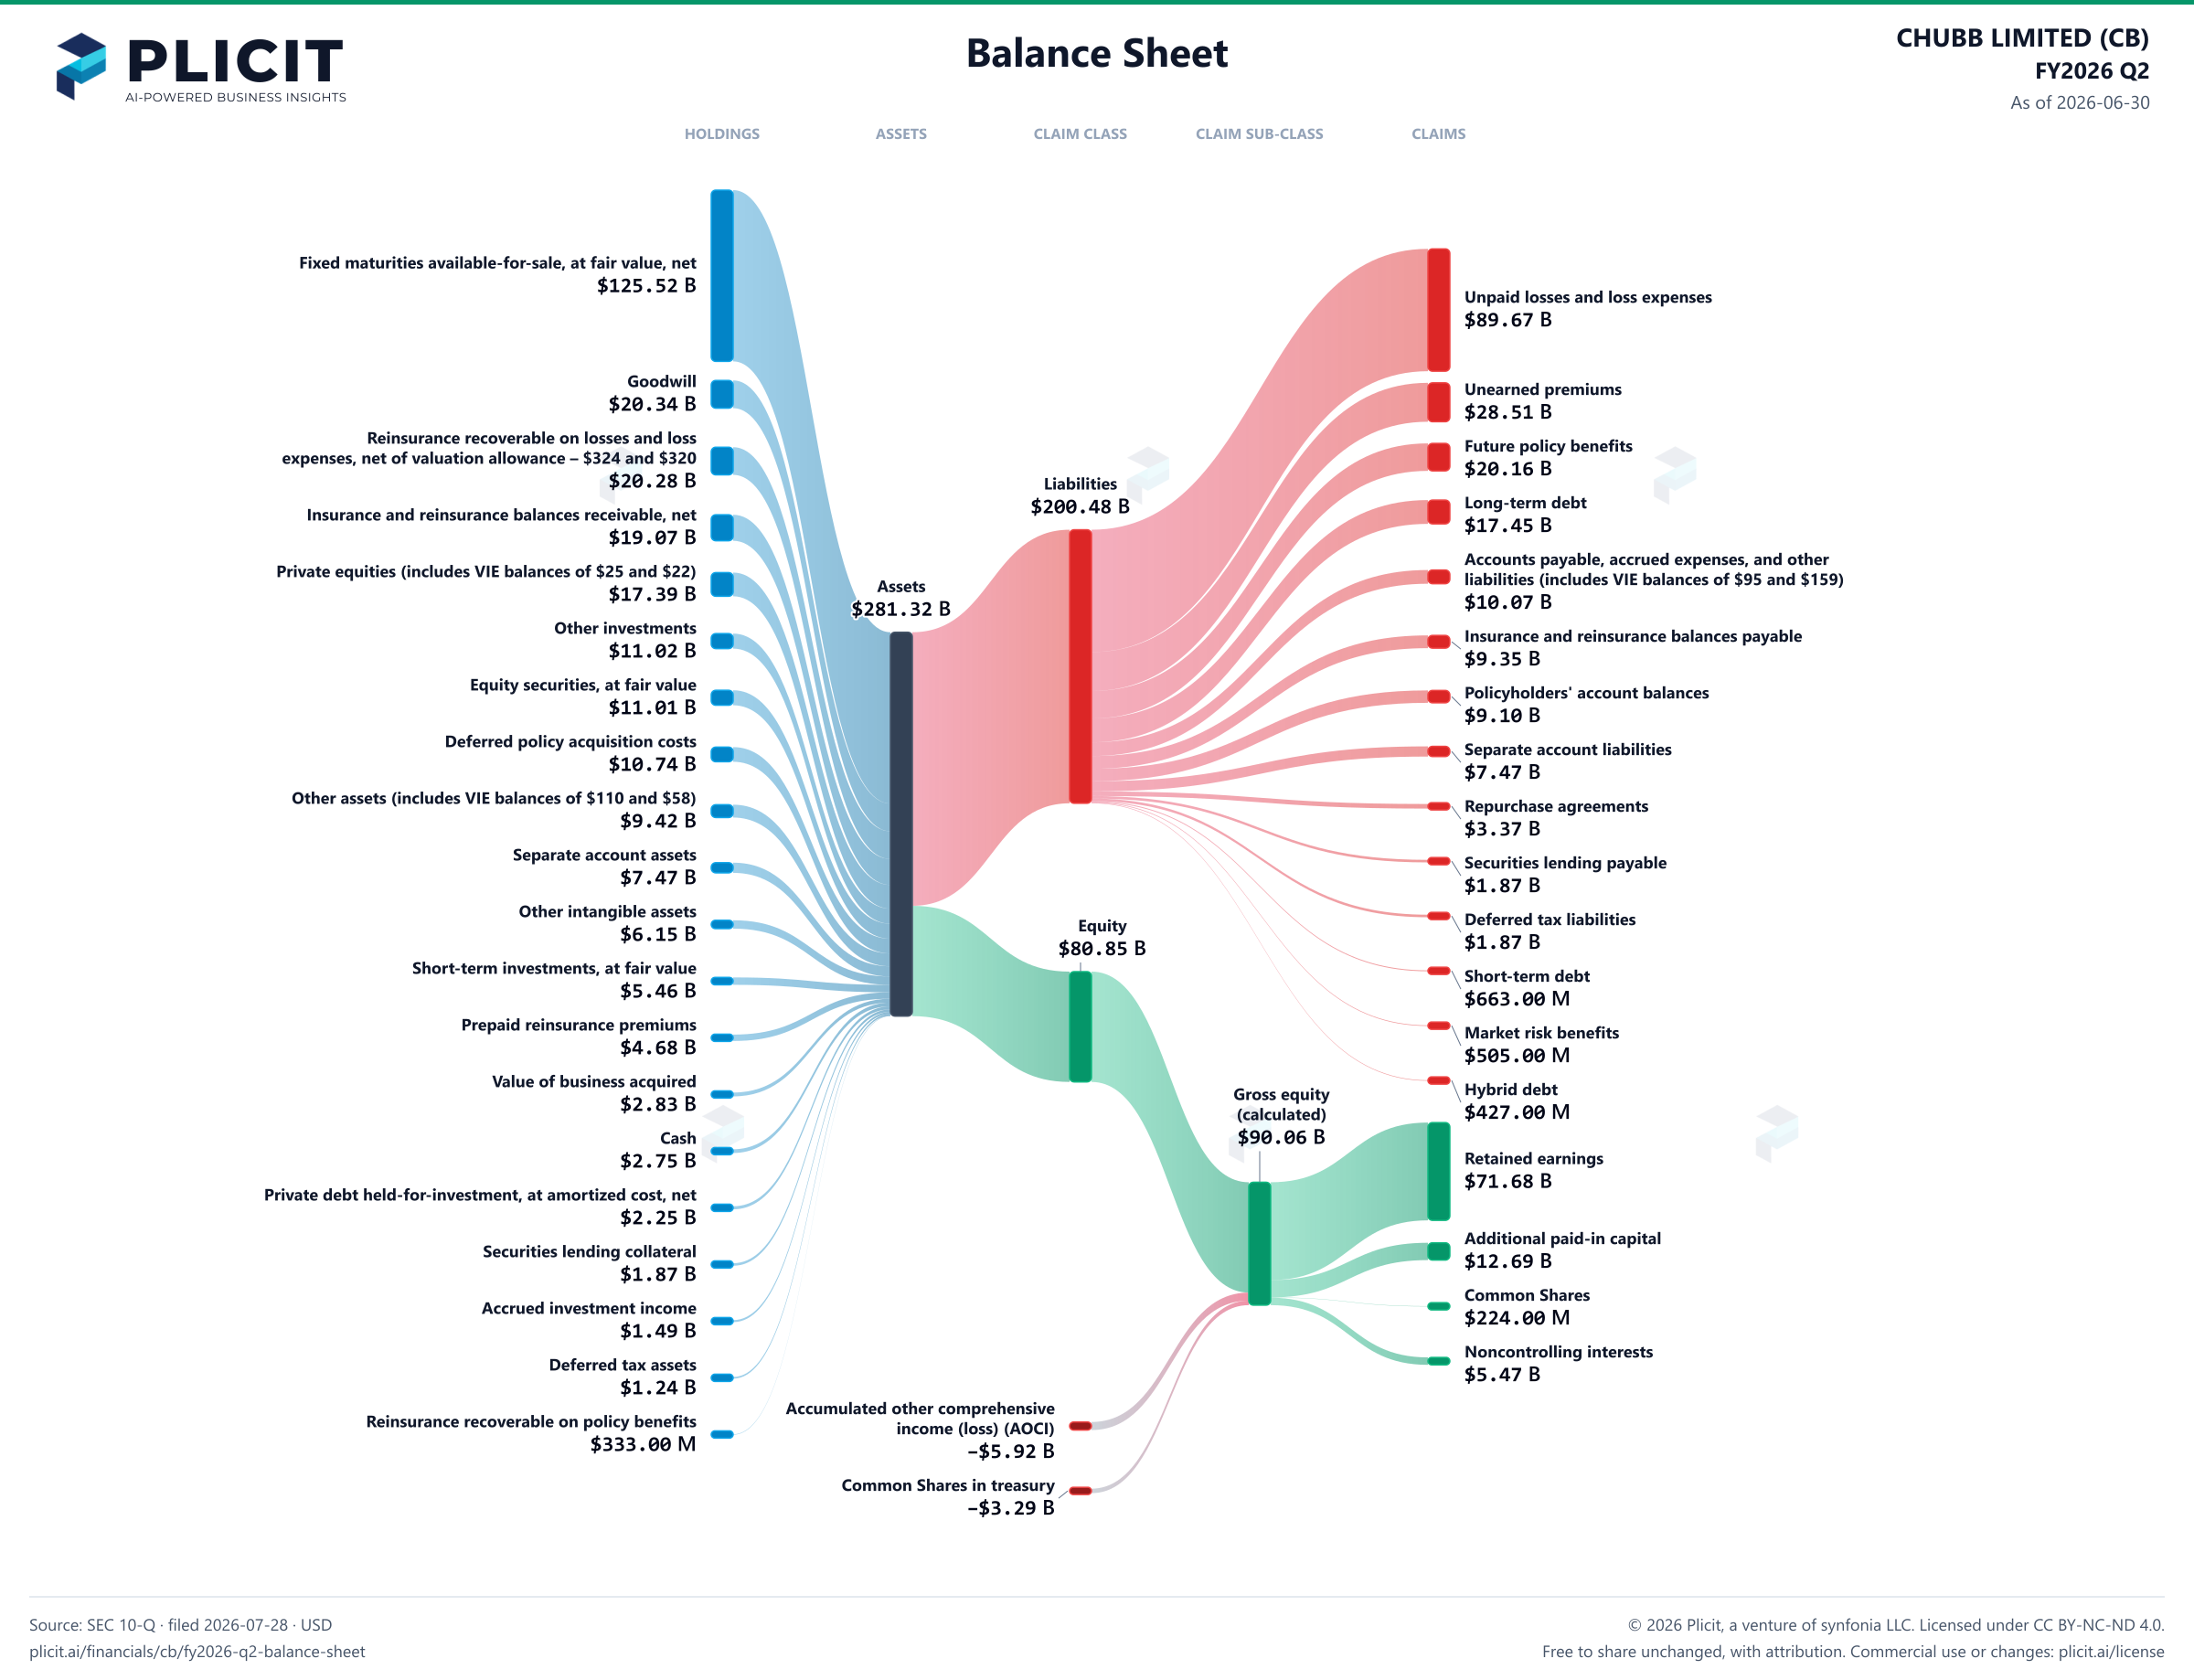
Balance sheet as of 2026-06-30. The chart shows assets, liabilities and equity at that date.
- Assets
- 281,322,000,000 US dollars
- Liabilities
- 200,477,000,000 US dollars
- Equity
- 80,845,000,000 US dollars
- Noncontrolling interest
- 5,473,000,000 US dollars. Included in consolidated equity; this amount is not added again.
- Fixed maturities available-for-sale, at fair value, net of valuation allowance – $48 and $52 (amortized cost – $129,028 and $124,726)
- 125,518,000,000 US dollars
- Goodwill
- 20,343,000,000 US dollars
- Reinsurance recoverable on losses and loss expenses, net of valuation allowance – $324 and $320
- 20,284,000,000 US dollars
- Insurance and reinsurance balances receivable, net of valuation allowance – $66 and $62
- 19,068,000,000 US dollars
- Private equities (includes VIE balances of $25 and $22)
- 17,385,000,000 US dollars
- Other investments (includes VIE balances of $5,050 and $5,818)
- 11,022,000,000 US dollars
- Equity securities, at fair value (includes VIE balances of $2,472 and $2,275)
- 11,014,000,000 US dollars
- Deferred policy acquisition costs
- 10,744,000,000 US dollars
- Other assets (includes VIE balances of $110 and $58)
- 9,423,000,000 US dollars
- Separate account assets
- 7,471,000,000 US dollars
- Other intangible assets
- 6,145,000,000 US dollars
- Short-term investments, at fair value (amortized cost – $5,459 and $4,840) (includes variable interest entities (VIE) balances of $108 and $105)
- 5,458,000,000 US dollars
- Prepaid reinsurance premiums
- 4,683,000,000 US dollars
- Value of business acquired
- 2,828,000,000 US dollars
- Cash, including restricted cash $243 and $198 (includes VIE balances of $243 and $168)
- 2,753,000,000 US dollars
- Private debt held-for-investment, at amortized cost, net of valuation allowance – $2 and $3
- 2,252,000,000 US dollars
- Securities lending collateral
- 1,870,000,000 US dollars
- Accrued investment income
- 1,491,000,000 US dollars
- Deferred tax assets
- 1,237,000,000 US dollars
- Reinsurance recoverable on policy benefits
- 333,000,000 US dollars
- Unpaid losses and loss expenses
- 89,669,000,000 US dollars
- Unearned premiums
- 28,511,000,000 US dollars
- Future policy benefits
- 20,159,000,000 US dollars
- Long-term debt
- 17,452,000,000 US dollars
- Accounts payable, accrued expenses, and other liabilities (includes VIE balances of $95 and $159)
- 10,065,000,000 US dollars
- Insurance and reinsurance balances payable
- 9,345,000,000 US dollars
- Policyholders' account balances
- 9,102,000,000 US dollars
- Separate account liabilities
- 7,471,000,000 US dollars
- Repurchase agreements (includes VIE balances of $930 and $956)
- 3,368,000,000 US dollars
- Securities lending payable
- 1,870,000,000 US dollars
- Deferred tax liabilities
- 1,870,000,000 US dollars
- Short-term debt
- 663,000,000 US dollars
- Market risk benefits
- 505,000,000 US dollars
- Hybrid debt
- 427,000,000 US dollars
- Retained earnings
- 71,675,000,000 US dollars
- Additional paid-in capital
- 12,689,000,000 US dollars
- Common Shares (CHF 0.50 par value; 400,120,847 and 412,107,421 shares issued; 385,634,049 and 391,101,227 shares outstanding)
- 224,000,000 US dollars
- Noncontrolling interests (includes VIE balances of $4,655 and $5,133)
- 5,473,000,000 US dollars
- Accumulated other comprehensive income (loss) (AOCI)
- negative 5,923,000,000 US dollars
- Common Shares in treasury (14,486,798 and 21,006,194 shares)
- negative 3,293,000,000 US dollars
- Gross equity (calculated)
- 90,061,000,000 US dollars. Net equity plus the magnitudes of its negative contributions equals gross positive equity. The negative contributions enter this reconciliation as add-backs; their filed signs stay negative.
Chart connections
- Assets equal liabilities plus consolidated equity. Consolidated equity includes noncontrolling interests when reported.
- Treasury shares and other negative equity contributions reduce equity.
Free to share unchanged, with credit to Plicit.ai · CC BY-NC-ND 4.0Download PNG
Product waitlist
Health Check and Teardown for your own company
A health check uncovers insights of your private books, not a public ticker. Join this list to get notified as soon as we go-live!