
COMCAST CORPORATION (CMCSA) FY2026 Q1 Balance Sheet
As of 2026-03-31
Balance Sheet
As of 2026-03-31
Swipe to see the full flow
Chart details
COMCAST CORPORATION (CMCSA) FY2026 Q1 Balance Sheet
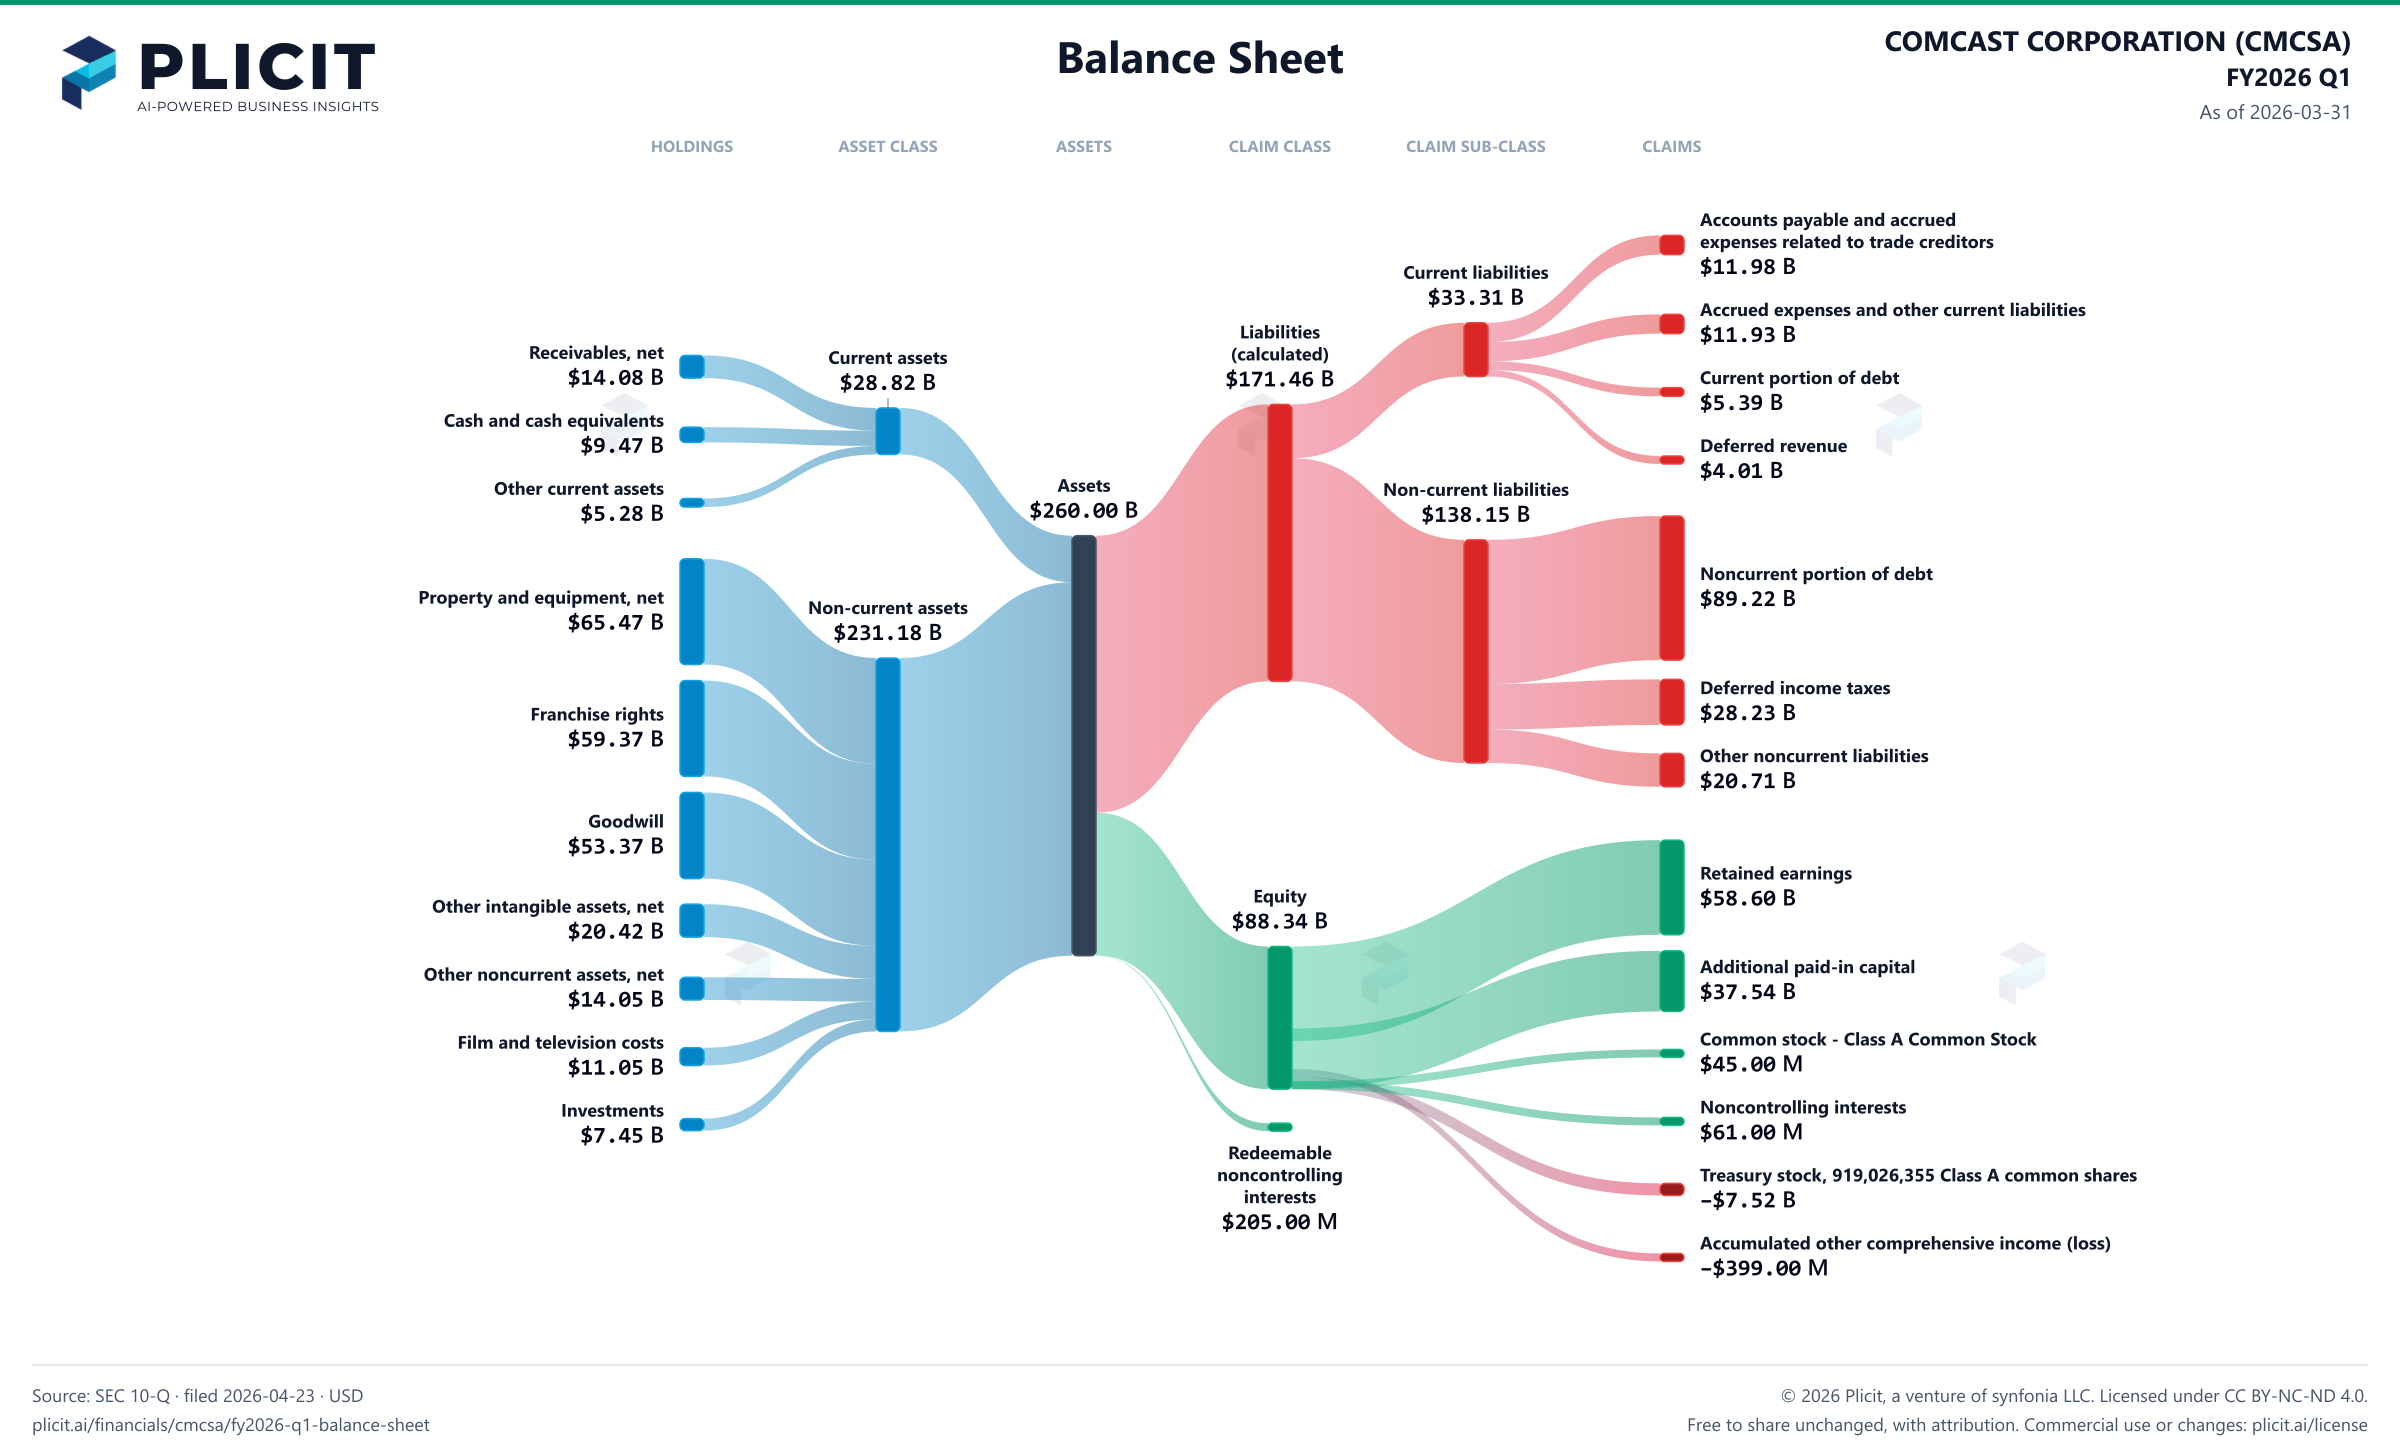
Balance sheet as of 2026-03-31. The chart shows assets, liabilities and equity at that date.
- Assets
- 260,002,000,000 US dollars
- Current assets
- 28,822,000,000 US dollars
- Non-current assets
- 231,180,000,000 US dollars
- Liabilities (calculated)
- 171,462,000,000 US dollars
- Current liabilities
- 33,308,000,000 US dollars
- Non-current liabilities
- 138,154,000,000 US dollars
- Equity
- 88,335,000,000 US dollars
- Redeemable noncontrolling interests
- 205,000,000 US dollars
- Noncontrolling interest
- 61,000,000 US dollars. Included in consolidated equity; this amount is not added again.
- Receivables, net
- 14,078,000,000 US dollars
- Cash and cash equivalents
- 9,468,000,000 US dollars
- Other current assets
- 5,275,000,000 US dollars
- Property and equipment, net of accumulated depreciation of $61,274 and $60,754
- 65,472,000,000 US dollars
- Franchise rights
- 59,365,000,000 US dollars
- Goodwill
- 53,374,000,000 US dollars
- Other intangible assets, net of accumulated amortization of $31,234 and $39,362
- 20,418,000,000 US dollars
- Other noncurrent assets, net
- 14,054,000,000 US dollars
- Film and television costs
- 11,047,000,000 US dollars
- Investments
- 7,450,000,000 US dollars
- Accounts payable and accrued expenses related to trade creditors
- 11,977,000,000 US dollars
- Accrued expenses and other current liabilities
- 11,932,000,000 US dollars
- Current portion of debt
- 5,394,000,000 US dollars
- Deferred revenue
- 4,006,000,000 US dollars
- Noncurrent portion of debt
- 89,218,000,000 US dollars
- Deferred income taxes
- 28,227,000,000 US dollars
- Other noncurrent liabilities
- 20,708,000,000 US dollars
- Retained earnings
- 58,602,000,000 US dollars
- Additional paid-in capital
- 37,543,000,000 US dollars
- Common stock - Class A Common Stock
- 45,000,000 US dollars
- Common stock - Class B Common Stock
- 0 US dollars
- Preferred stock—authorized, 20,000,000 shares; issued, zero
- 0 US dollars
- Noncontrolling interests
- 61,000,000 US dollars
- Treasury stock, 919,026,355 Class A common shares
- negative 7,517,000,000 US dollars
- Accumulated other comprehensive income (loss)
- negative 399,000,000 US dollars
Chart connections
- Assets equal liabilities plus temporary equity plus consolidated equity. Consolidated equity includes noncontrolling interests when reported.
- Treasury shares and other negative equity contributions reduce equity.
- The filed current assets lines add up to $28,821.00 M and the current assets total is $28,822.00 M; the $1.00 M difference is within the rounding of the filed amounts.
- The filed current liabilities lines add up to $33,309.00 M and the current liabilities total is $33,308.00 M; the $1.00 M difference is within the rounding of the filed amounts.
- The filed non-current liabilities lines add up to $138,153.00 M and the non-current liabilities total is $138,154.00 M; the $1.00 M difference is within the rounding of the filed amounts.
Free to share unchanged, with credit to Plicit.ai · CC BY-NC-ND 4.0Download PNG
Product waitlist
Health Check and Teardown for your own company
A health check uncovers insights of your private books, not a public ticker. Join this list to get notified as soon as we go-live!