
COMCAST CORPORATION (CMCSA) FY2026 Q2 Balance Sheet

Balance Sheet

As of 2026-06-30

Swipe to see the full flow
COMCAST CORPORATION (CMCSA) FY2026 Q2 Balance SheetBalance sheet as of 2026-06-30. The chart shows assets, liabilities and equity at that date.Current liabilities$33.09 BCurrent assets$26.34 BLiabilities(calculated)$167.59 BAssets$257.55 BNon-current liabilities$134.50 BNon-current assets$231.21 BEquity$89.77 BGross equity(calculated)$98.03 BRedeemable noncontrolling interests$185.00 MHOLDINGSASSET CLASSASSETSCLAIM CLASSCLAIM SUB-CLASSCLAIMSReceivables, netCash and cash equivalentsOther current assetsProperty and equipment, net of accumulated depreciation of $62,017 and $60,754Franchise rightsGoodwillOther intangible assets, net of accumulated amortization of $31,818 and $39,362Other noncurrent assets, netFilm and television costsInvestmentsAccounts payable and accrued expenses related to trade creditorsAccrued expenses and other current liabilitiesCurrent portion of debtDeferred revenueNoncurrent portion of debtDeferred income taxesOther noncurrent liabilitiesRetained earningsAdditional paid-in capitalCommon stock - Class A Common StockNoncontrolling interestsCurrent assetsNon-current assetsAssetsCurrent liabilitiesNon-current liabilitiesLiabilities (calculated)EquityGross equity (calculated)Treasury stock, 919,026,355 Class A common sharesAccumulated other comprehensive income (loss)Redeemable noncontrolling interestsAccounts payable and accrued expenses related to trade creditorsAccounts payable and accruedexpenses related to trade creditors$11.86 BCurrent liabilitiesCurrent liabilities$33.09 BReceivables, netReceivables, net$13.96 BCurrent assetsCurrent assets$26.34 BAccrued expenses and other current liabilitiesAccrued expenses and other current liabilities$11.33 BLiabilities (calculated)Liabilities(calculated)$167.59 BCash and cash equivalentsCash and cash equivalents$7.66 BCurrent portion of debtCurrent portion of debt$6.12 BAssetsAssets$257.55 BOther current assetsOther current assets$4.72 BDeferred revenueDeferred revenue$3.79 BNon-current liabilitiesNon-current liabilities$134.50 BNon-current assetsNon-current assets$231.21 BProperty and equipment, net of accumulated depreciation of $62,017 and $60,754Property and equipment, net$66.13 BNoncurrent portion of debtNoncurrent portion of debt$84.26 BFranchise rightsFranchise rights$59.37 BDeferred income taxesDeferred income taxes$28.94 BEquityEquity$89.77 BOther noncurrent liabilitiesOther noncurrent liabilities$21.30 BGoodwillGoodwill$53.07 BGross equity (calculated)Gross equity(calculated)$98.03 BOther intangible assets, net of accumulated amortization of $31,818 and $39,362Other intangible assets, net$19.69 BRetained earningsRetained earnings$60.30 BOther noncurrent assets, netOther noncurrent assets, net$14.67 BRedeemable noncontrolling interestsRedeemable noncontrolling interests$185.00 MAdditional paid-in capitalAdditional paid-in capital$37.68 BFilm and television costsFilm and television costs$10.47 BCommon stock - Class A Common StockCommon stock - Class A Common Stock$45.00 MInvestmentsInvestments$7.83 BNoncontrolling interestsNoncontrolling interests$7.00 MTreasury stock, 919,026,355 Class A common sharesTreasury stock, 919,026,355 Class A common shares−$7.52 BAccumulated other comprehensive income (loss)Accumulated other comprehensive income (loss)−$743.00 M
Chart details

COMCAST CORPORATION (CMCSA) FY2026 Q2 Balance Sheet

Balance sheet as of 2026-06-30. The chart shows assets, liabilities and equity at that date.

Assets
257,548,000,000 US dollars
Current assets
26,335,000,000 US dollars
Non-current assets
231,213,000,000 US dollars
Liabilities (calculated)
167,593,000,000 US dollars
Current liabilities
33,093,000,000 US dollars
Non-current liabilities
134,500,000,000 US dollars
Equity
89,770,000,000 US dollars
Redeemable noncontrolling interests
185,000,000 US dollars
Noncontrolling interest
7,000,000 US dollars. Included in consolidated equity; this amount is not added again.
Receivables, net
13,955,000,000 US dollars
Cash and cash equivalents
7,661,000,000 US dollars
Other current assets
4,718,000,000 US dollars
Property and equipment, net of accumulated depreciation of $62,017 and $60,754
66,127,000,000 US dollars
Franchise rights
59,365,000,000 US dollars
Goodwill
53,070,000,000 US dollars
Other intangible assets, net of accumulated amortization of $31,818 and $39,362
19,687,000,000 US dollars
Other noncurrent assets, net
14,669,000,000 US dollars
Film and television costs
10,467,000,000 US dollars
Investments
7,828,000,000 US dollars
Accounts payable and accrued expenses related to trade creditors
11,864,000,000 US dollars
Accrued expenses and other current liabilities
11,325,000,000 US dollars
Current portion of debt
6,117,000,000 US dollars
Deferred revenue
3,787,000,000 US dollars
Noncurrent portion of debt
84,264,000,000 US dollars
Deferred income taxes
28,940,000,000 US dollars
Other noncurrent liabilities
21,296,000,000 US dollars
Retained earnings
60,298,000,000 US dollars
Additional paid-in capital
37,680,000,000 US dollars
Common stock - Class A Common Stock
45,000,000 US dollars
Common stock - Class B Common Stock
0 US dollars
Preferred stock—authorized, 20,000,000 shares; issued, zero
0 US dollars
Noncontrolling interests
7,000,000 US dollars
Treasury stock, 919,026,355 Class A common shares
negative 7,517,000,000 US dollars
Accumulated other comprehensive income (loss)
negative 743,000,000 US dollars
Gross equity (calculated)
98,030,000,000 US dollars. Net equity plus the magnitudes of its negative contributions equals gross positive equity. The negative contributions enter this reconciliation as add-backs; their filed signs stay negative.

Chart connections

  • Assets equal liabilities plus temporary equity plus consolidated equity. Consolidated equity includes noncontrolling interests when reported.
  • Treasury shares and other negative equity contributions reduce equity.
  • The filed current assets lines add up to $26,334.00 M and the current assets total is $26,335.00 M; the $1.00 M difference is within the rounding of the filed amounts.
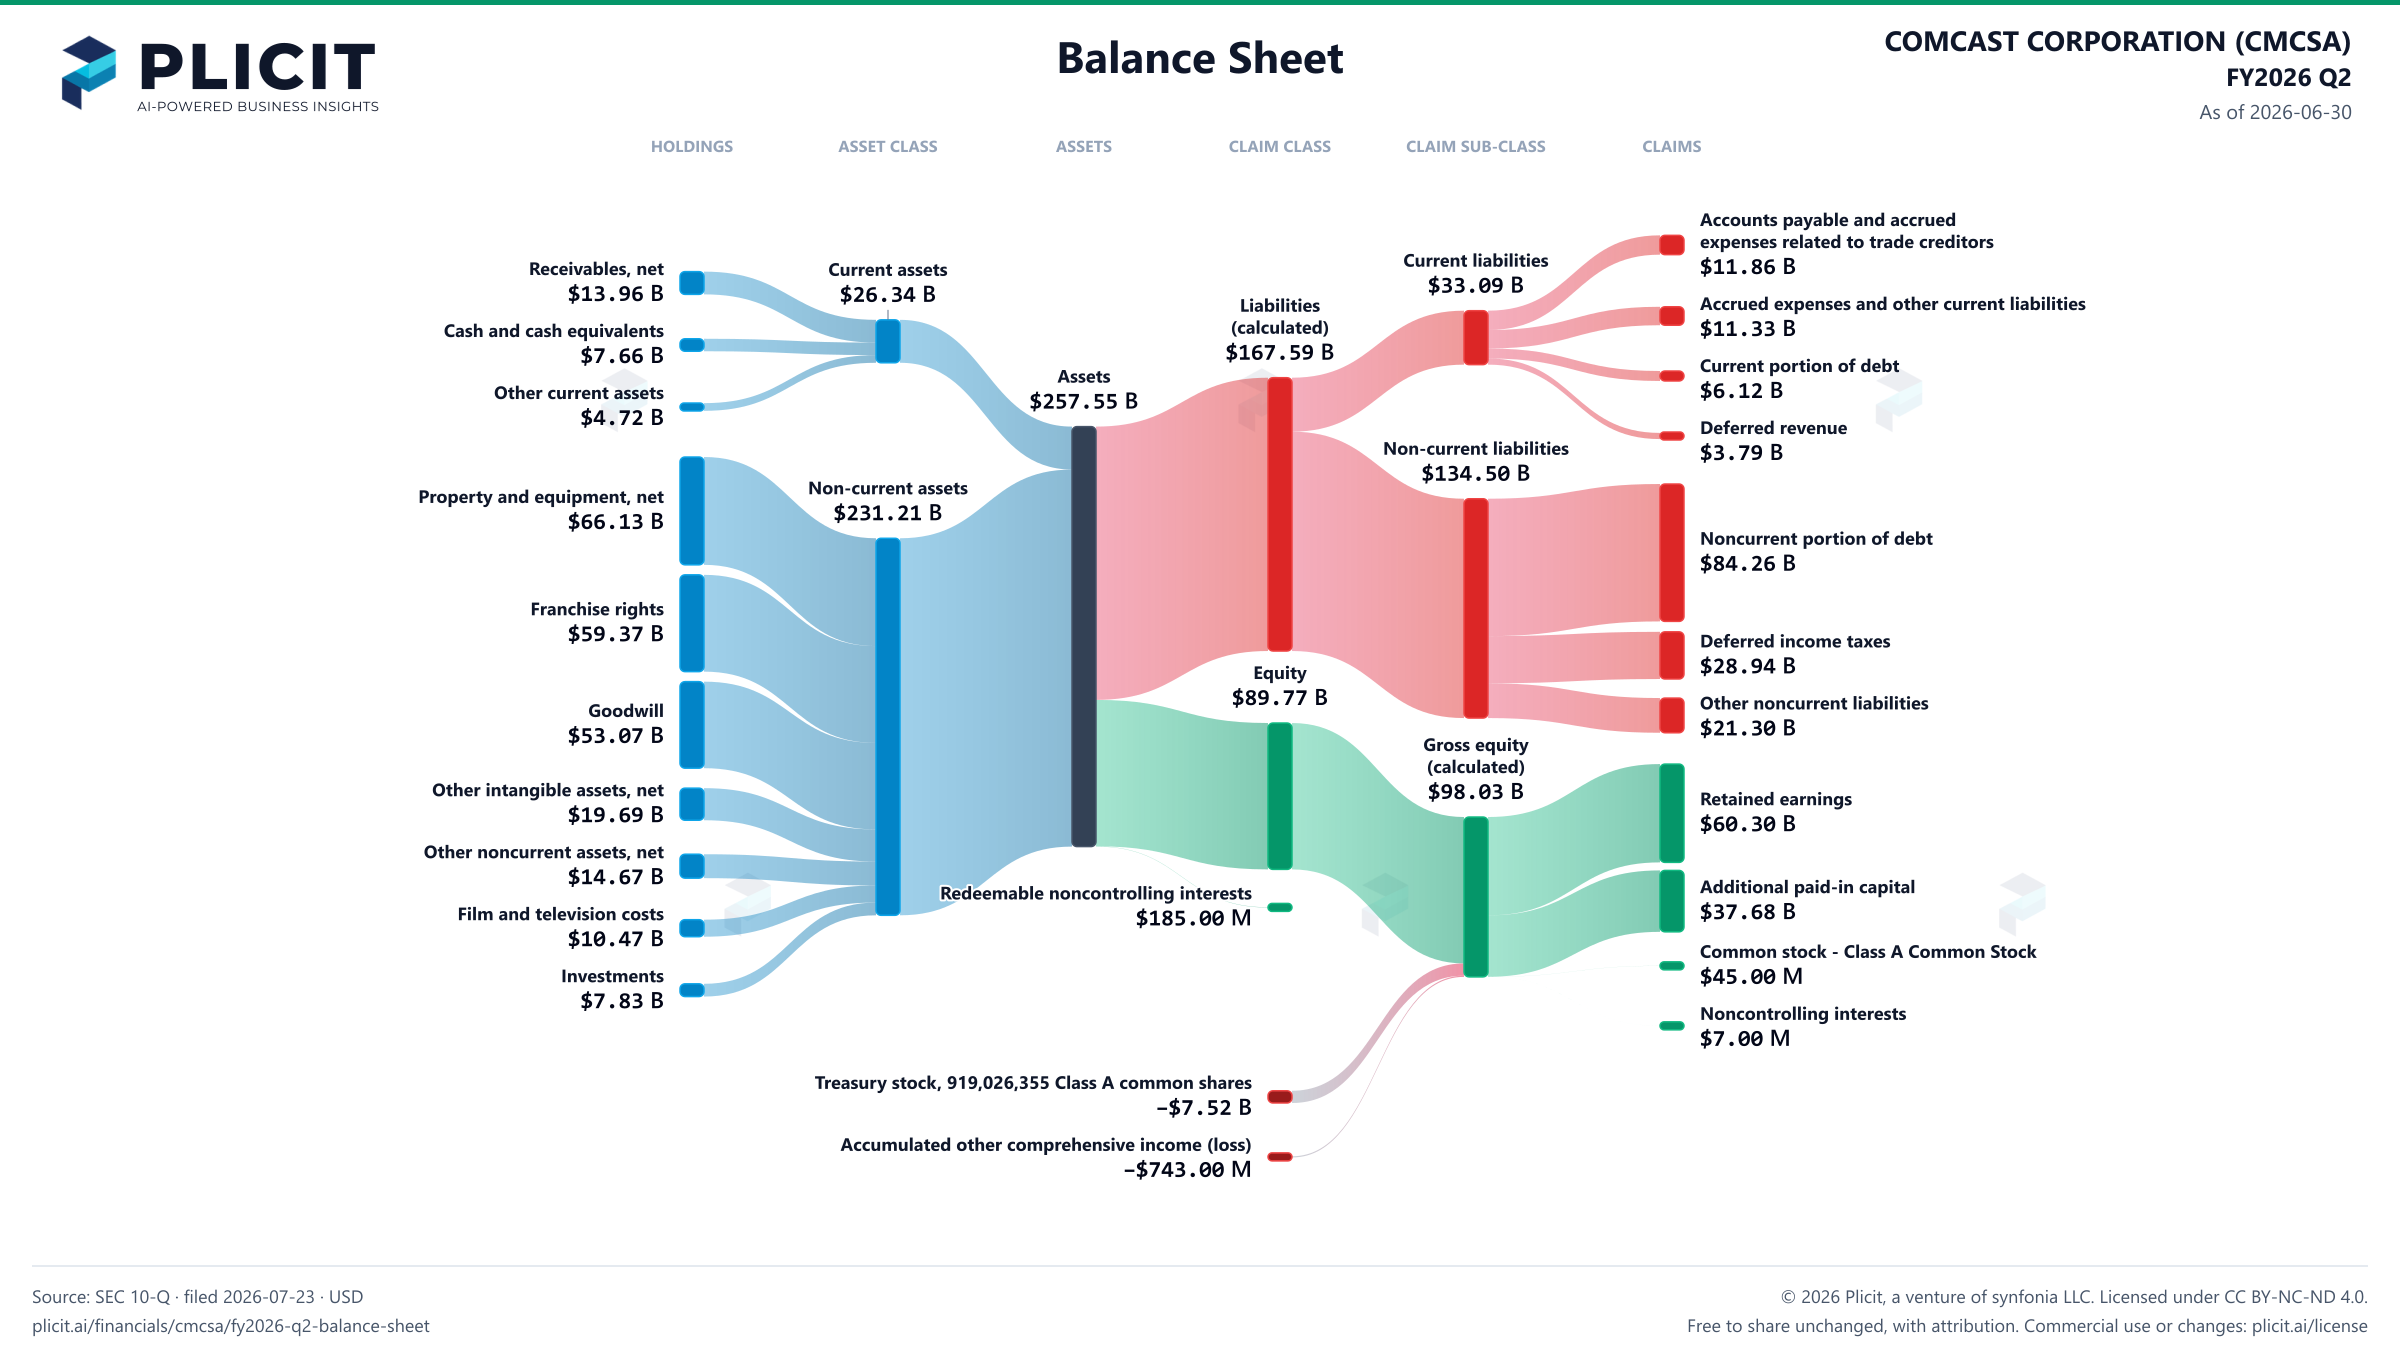
COMCAST CORPORATION (CMCSA) FY2026 Q2 Balance Sheet Sankey chart
Free to share unchanged, with credit to Plicit.ai · CC BY-NC-ND 4.0Download PNG

Newsletter

Get the teardowns by email

Subscribe if you want the public-company teardowns in your inbox when they're released.

Product waitlist

Health Check and Teardown for your own company

A health check uncovers insights of your private books, not a public ticker. Join this list to get notified as soon as we go-live!