
Published · Updated Source: Form 10-Q on SEC EDGAR filed (opens in a new tab)

Key Takeaways

  • Ford Blue's segment total is $38.40 B, and $11.32 B of that is sold inside Ford.
  • Ford Blue's segment sales fell $989.00 M from a year earlier, the biggest dollar drop here.
  • Ford Model e fell 33% to $1.27 B, the steepest percentage drop in the view.
  • Ford Blue's internal sales equal 23% of total company revenue of $49.53 B.

The Unvarnished Truth

Ford Blue's $38.40 B figure counts $11.32 B sold within Ford

Ford Blue appears in this view at $38.40 B, 78% of the company's sales. That figure includes $11.32 B that Ford Blue sold to other Ford businesses. Those internal sales equal 23% of total revenue of $49.53 B. Outside customers pay for the rest, and in the five-way view Ford Blue is $27.08 B. That gap is the first thing to check in any Ford Blue figure. That figure is the one most readers will quote, so the gap matters.

Ford Blue's segment sales fell $989.00 M from a year earlier, the biggest dollar drop in this view. Ford Model e fell 33% to $1.27 B, the steepest percentage drop. Ford Pro grew to $17.77 B, 36% of sales, and Ford Credit grew 2.8%. The headline mix hides where the money moves, which is why a single share figure misleads. Ford Blue's drop is the largest in dollars, while Ford Model e's is the largest in percent, so the two tell different stories.

Internal sales matter for a simple reason: if sister businesses pay for $11.32 B of Ford Blue's figure, its 78% share overstates what outside buyers choose. The five-way view of the same revenue puts Ford Blue at $27.08 B. Both numbers come from the same filing, and the difference is the internal sales. A lender reading only the headline would take the larger number. Which of the two figures would a buyer of Ford's stock treat as the real business?
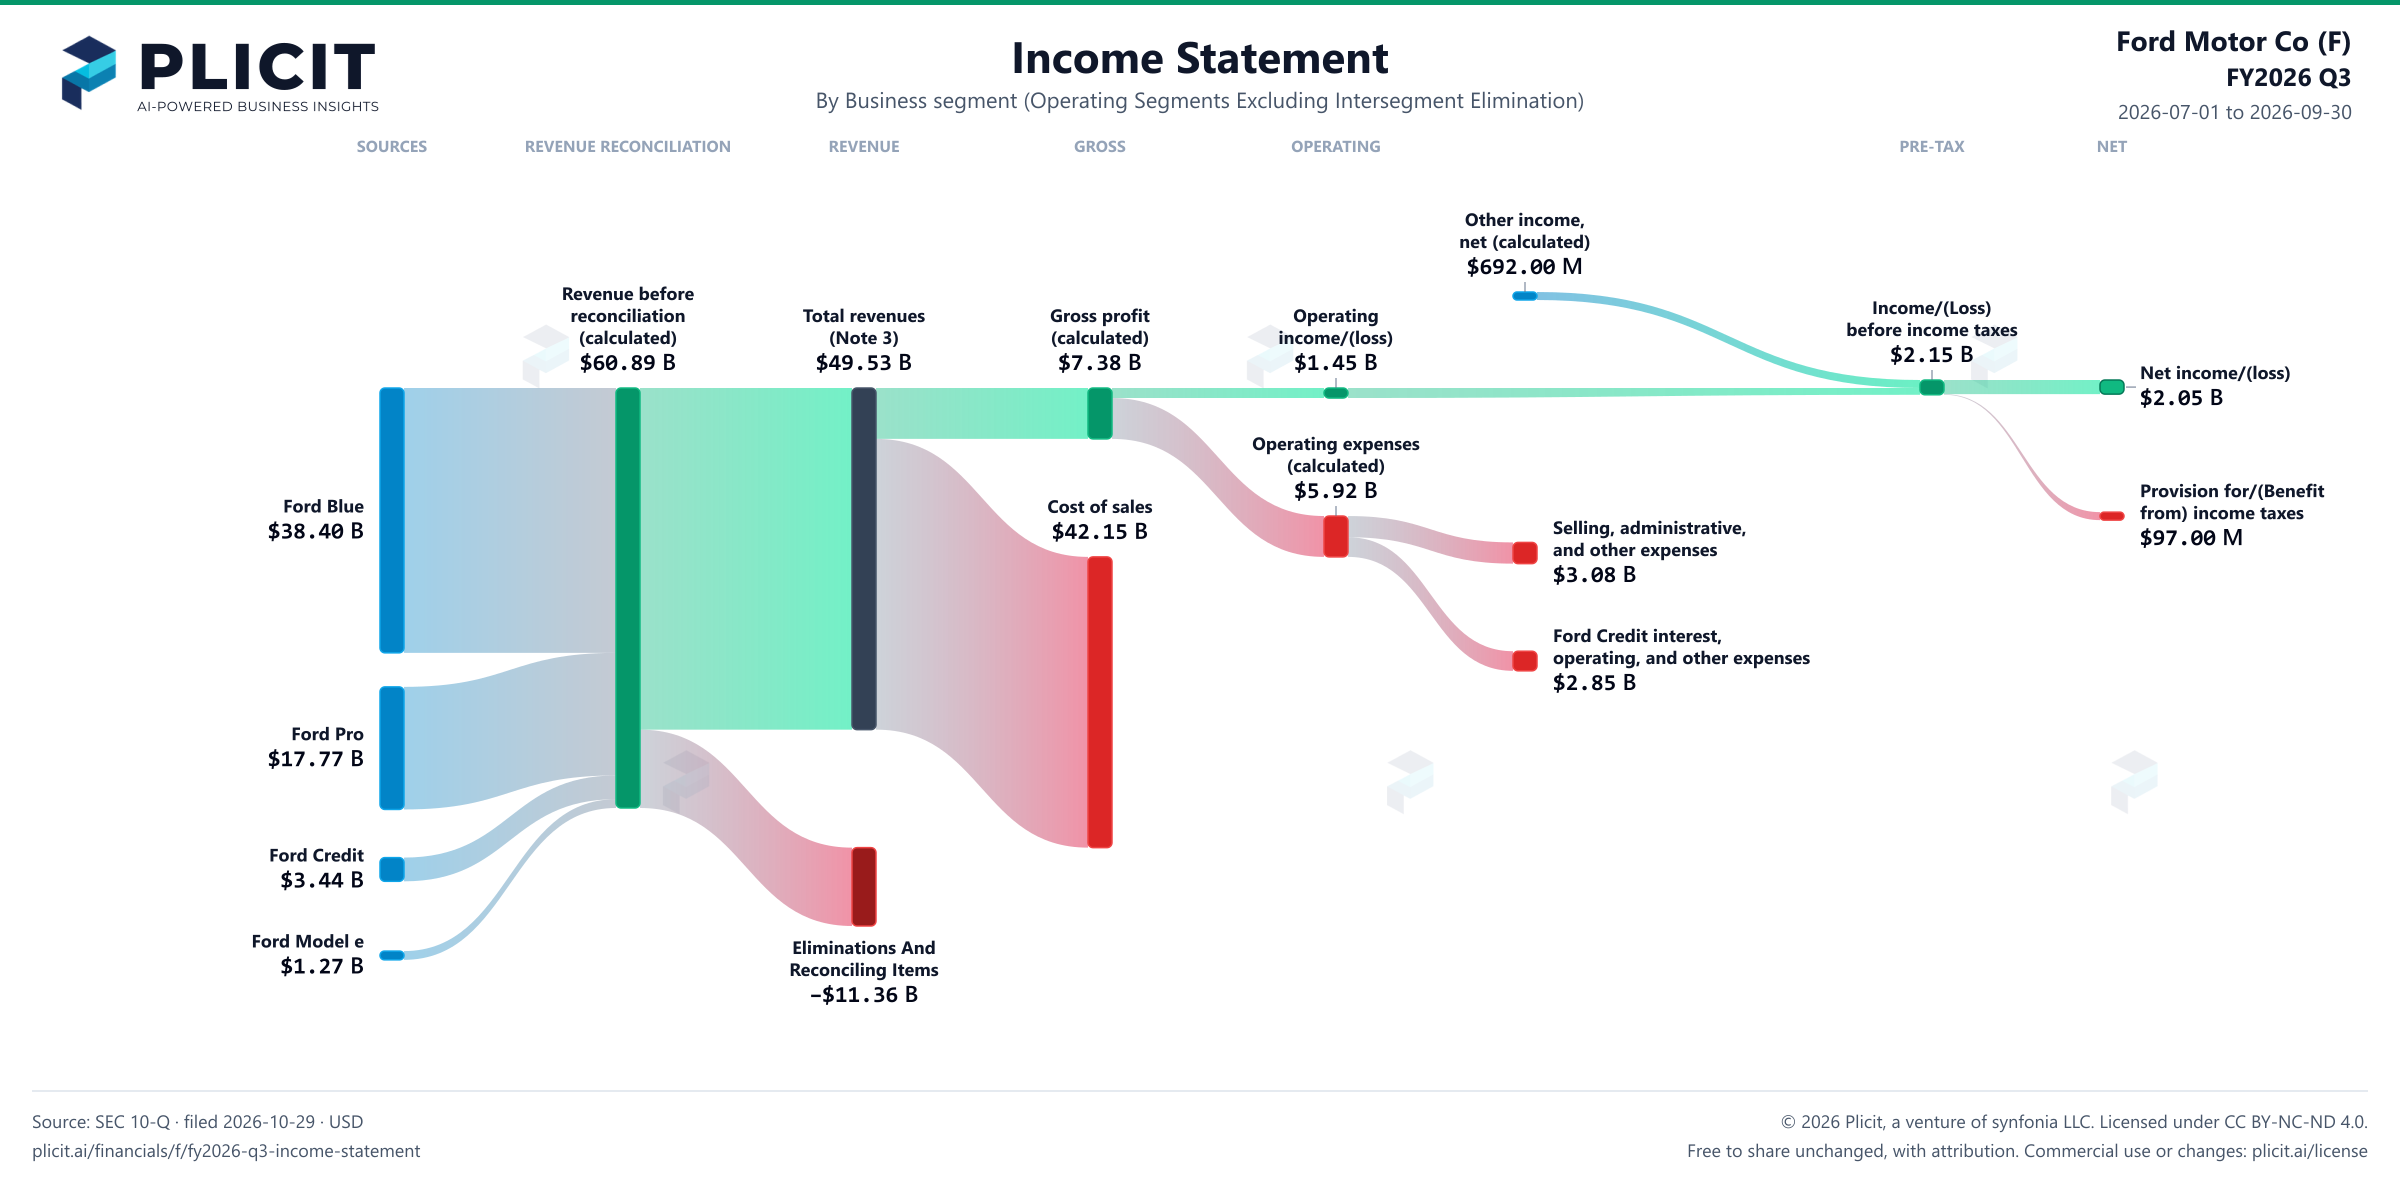
Revenue by Business Segment

Swipe to see the full flow
Ford Motor Co (F) FY2026 Q3 P&L / Income StatementIncome statement for 2026-07-01 through 2026-09-30. View: Business segment (Operating Segments Excluding Intersegment Elimination). Revenue uses this breakdown; costs and expenses retain the consolidated categories.SOURCESREVENUE RECONCILIATIONREVENUEGROSSOPERATINGPRE-TAXNETFord BlueFord ProFord CreditFord Model eTotal revenues (Note 3)Revenue before reconciliation (calculated)Eliminations And Reconciling ItemsGross profit (calculated)Cost of salesOperating income/(loss)Operating expenses (calculated)Selling, administrative, and other expensesFord Credit interest, operating, and other expensesOther income (expense), net (calculated)Income/(Loss) before income taxesNet income/(loss)Provision for/(Benefit from) income taxesOther income (expense), net (calculated)Other income,net (calculated)$692.00 MRevenue before reconciliation (calculated)Revenue beforereconciliation(calculated)$60.89 BIncome/(Loss) before income taxesIncome/(Loss)before income taxes$2.15 BTotal revenues (Note 3)Total revenues(Note 3)$49.53 BGross profit (calculated)Gross profit(calculated)$7.38 BOperating income/(loss)Operatingincome/(loss)$1.45 BNet income/(loss)Net income/(loss)$2.05 BOperating expenses (calculated)Operating expenses(calculated)$5.92 BProvision for/(Benefit from) income taxesProvision for/(Benefitfrom) income taxes$97.00 MFord BlueFord Blue$38.40 BCost of salesCost of sales$42.15 BSelling, administrative, and other expensesSelling, administrative,and other expenses$3.08 BFord Credit interest, operating, and other expensesFord Credit interest,operating, and other expenses$2.85 BFord ProFord Pro$17.77 BFord CreditFord Credit$3.44 BFord Model eFord Model e$1.27 BEliminations And Reconciling ItemsEliminations AndReconciling Items−$11.36 B
Chart details

Ford Motor Co (F) FY2026 Q3 P&L / Income Statement

Income statement for 2026-07-01 through 2026-09-30. View: Business segment (Operating Segments Excluding Intersegment Elimination). Revenue uses this breakdown; costs and expenses retain the consolidated categories.

Total revenues (Note 3)
49,526,000,000 US dollars
Cost of sales
42,148,000,000 US dollars
Gross profit (calculated)
7,378,000,000 US dollars
Operating expenses (calculated)
5,924,000,000 US dollars
Operating income/(loss)
1,454,000,000 US dollars
Other income (expense), net (calculated)
692,000,000 US dollars
Income/(Loss) before income taxes
2,146,000,000 US dollars
Provision for/(Benefit from) income taxes
97,000,000 US dollars
Net income/(loss)
2,049,000,000 US dollars
Ford Blue
38,397,000,000 US dollars
Ford Credit
3,444,000,000 US dollars
Ford Model e
1,272,000,000 US dollars
Ford Pro
17,772,000,000 US dollars
Ford Credit interest, operating, and other expenses
2,845,000,000 US dollars
Selling, administrative, and other expenses
3,079,000,000 US dollars
Revenue before reconciliation (calculated)
60,885,000,000 US dollars. Sum of the reported revenue categories before the separately reported reconciliation.
Eliminations And Reconciling Items
negative 11,359,000,000 US dollars. Reported reconciliation to consolidated revenue.

Chart connections

  • Revenue less cost of revenue equals gross profit; gross profit less operating expenses equals operating income.
  • Operating income plus other income or expense equals income before tax. Income before tax less income tax expense or benefit equals net income.
  • Reported revenue categories plus the separately reported signed reconciliation equals consolidated revenue.
Ford Motor Co (F) FY2026 Q3 Revenue by Business Segment Sankey chart
Free to share unchanged, with credit to Plicit.ai · CC BY-NC-ND 4.0Download PNG

Intelligent Insights for Investors

Which of Ford's businesses brings in the most sales?

Ford Blue carries the most sales, at 78% of the company total this quarter, with $38.40 B of segment revenue. Ford Pro is next at 36%.

Which parts of Ford's sales drove the change over the past year?

Mostly Ford Blue: it lost $989.00 M of the $1.01 B fall in revenue from a year earlier, while Ford Pro grew.

Which business lost the most ground over the past year?

Ford Model e's revenue fell 33% from a year earlier, while revenue as a whole fell 2.0%.

Intelligent Insights for Everyone

Which of Ford's businesses grew fastest over the past year?

Ford Credit grew fastest, by 3% from a year earlier, outpacing the -2% growth of the whole. A part that outgrows the whole takes a bigger share of the mix.

Product waitlist

Health Check and Teardown for your own company

A health check uncovers insights of your private books, not a public ticker. Join this list to get notified as soon as we go-live!