
Published · Updated Source: Form 10-Q on SEC EDGAR filed (opens in a new tab)

Key Takeaways

  • Ford outside Ford Credit brought in 93% of sales, and its sales fell 2.3%.
  • Ford Credit, only 7% of sales, grew 2.8% to $3.44 B while the rest of Ford shrank.
  • Ford Credit holds $160.81 B of assets, about 55% of everything Ford owns.
  • The biggest business's share barely moved, slipping from 93.4% to 93.0%.

The Unvarnished Truth

Ford outside its finance arm shrank 2.3% while Ford Credit grew

Ford's sales fell 2% to $49.53 B, and Ford outside its finance arm did all of the falling. Ford outside Ford Credit brings in 93% of revenue, and its sales shrank 2.3% to $46.08 B. That is a drop of $1.10 B from a year earlier. Ford Credit went the other way, rising 2.8% to $3.44 B. Its sales are small next to the rest of Ford, which makes the shift easy to miss in the headline number. Read the headline and the shift looks small.

Ford Credit, the finance arm, is the only part of the business moving up on this view. It holds $160.81 B of assets, about 55% of the $292.48 B on the balance sheet. A business that makes up 7% of sales carries more than half of the company's assets. Most of those assets are finance receivables, so their value depends on borrowers paying on time. Ford Credit's profit depends on how those loans perform, which this view does not show.

The sales mix barely moved over the year: the largest business gave up under a point of share, from 93.4% to 93.0%. The stable mix hides a shrinking core. Dollars tell a sharper story than shares do. As the car business loses ground, the balance sheet leans more on Ford Credit. Watch the dollar lines, not the share lines. If the finance arm's loans stop paying as expected, which part of Ford will carry the balance sheet, and what keeps the profit flowing?
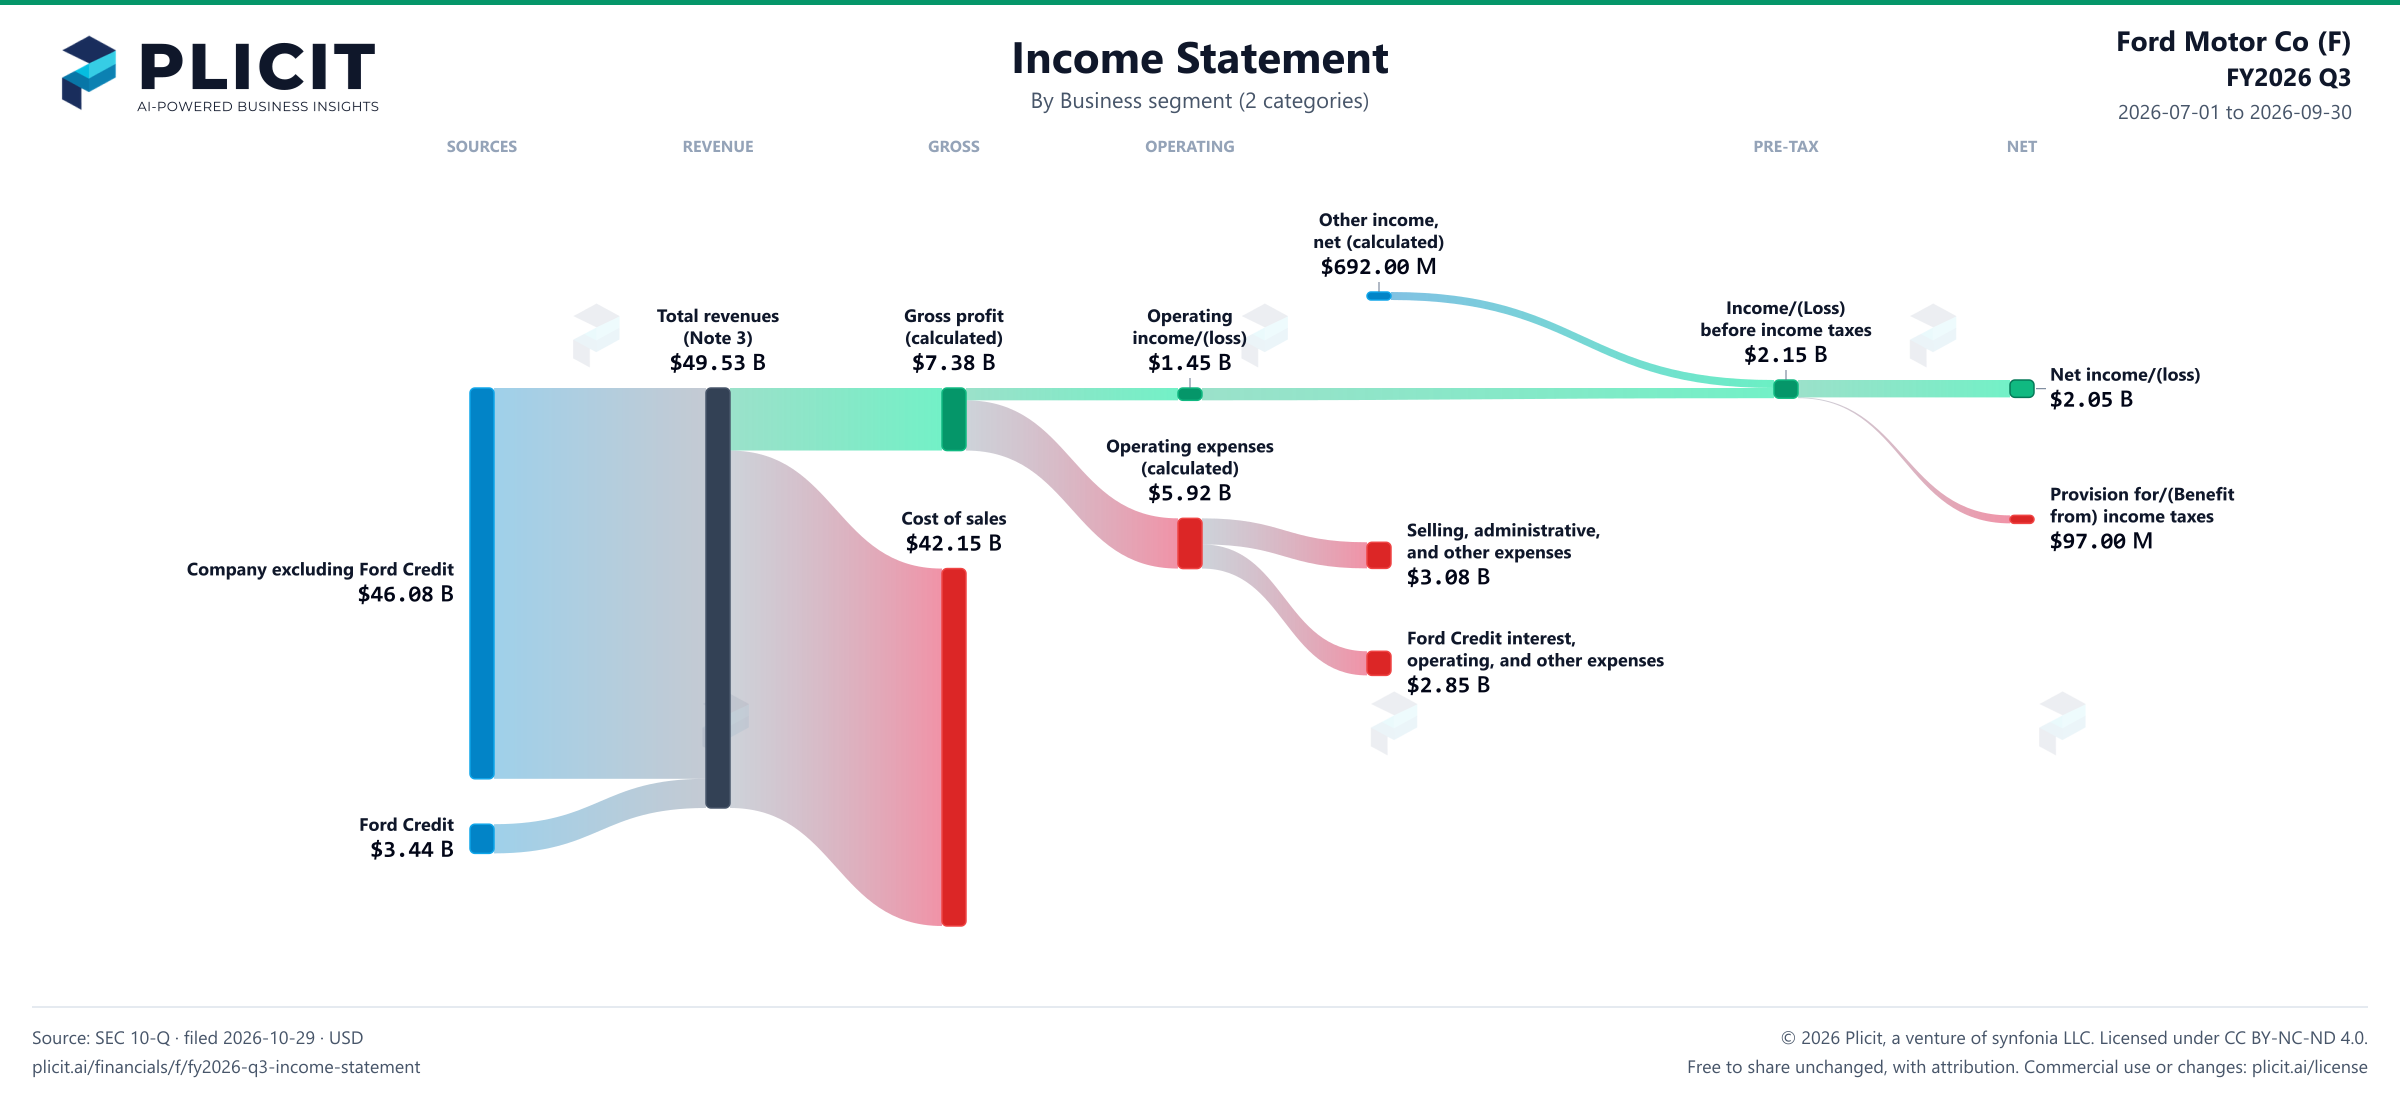
Revenue by Business Segment (2 categories)

Swipe to see the full flow
Ford Motor Co (F) FY2026 Q3 P&L / Income StatementIncome statement for 2026-07-01 through 2026-09-30. View: Business segment (2 categories). Revenue uses this breakdown; costs and expenses retain the consolidated categories.SOURCESREVENUEGROSSOPERATINGPRE-TAXNETCompany excluding Ford CreditFord CreditTotal revenues (Note 3)Gross profit (calculated)Cost of salesOperating income/(loss)Operating expenses (calculated)Selling, administrative, and other expensesFord Credit interest, operating, and other expensesOther income (expense), net (calculated)Income/(Loss) before income taxesNet income/(loss)Provision for/(Benefit from) income taxesOther income (expense), net (calculated)Other income,net (calculated)$692.00 MIncome/(Loss) before income taxesIncome/(Loss)before income taxes$2.15 BTotal revenues (Note 3)Total revenues(Note 3)$49.53 BGross profit (calculated)Gross profit(calculated)$7.38 BOperating income/(loss)Operatingincome/(loss)$1.45 BNet income/(loss)Net income/(loss)$2.05 BOperating expenses (calculated)Operating expenses(calculated)$5.92 BProvision for/(Benefit from) income taxesProvision for/(Benefitfrom) income taxes$97.00 MCost of salesCost of sales$42.15 BSelling, administrative, and other expensesSelling, administrative,and other expenses$3.08 BCompany excluding Ford CreditCompany excluding Ford Credit$46.08 BFord Credit interest, operating, and other expensesFord Credit interest,operating, and other expenses$2.85 BFord CreditFord Credit$3.44 B
Chart details

Ford Motor Co (F) FY2026 Q3 P&L / Income Statement

Income statement for 2026-07-01 through 2026-09-30. View: Business segment (2 categories). Revenue uses this breakdown; costs and expenses retain the consolidated categories.

Total revenues (Note 3)
49,526,000,000 US dollars
Cost of sales
42,148,000,000 US dollars
Gross profit (calculated)
7,378,000,000 US dollars
Operating expenses (calculated)
5,924,000,000 US dollars
Operating income/(loss)
1,454,000,000 US dollars
Other income (expense), net (calculated)
692,000,000 US dollars
Income/(Loss) before income taxes
2,146,000,000 US dollars
Provision for/(Benefit from) income taxes
97,000,000 US dollars
Net income/(loss)
2,049,000,000 US dollars
Company excluding Ford Credit
46,082,000,000 US dollars
Ford Credit
3,444,000,000 US dollars
Ford Credit interest, operating, and other expenses
2,845,000,000 US dollars
Selling, administrative, and other expenses
3,079,000,000 US dollars

Chart connections

  • Revenue less cost of revenue equals gross profit; gross profit less operating expenses equals operating income.
  • Operating income plus other income or expense equals income before tax. Income before tax less income tax expense or benefit equals net income.
Ford Motor Co (F) FY2026 Q3 Revenue by Business Segment (2 categories) Sankey chart
Free to share unchanged, with credit to Plicit.ai · CC BY-NC-ND 4.0Download PNG

Intelligent Insights for Investors

Which of Ford's businesses brings in the most sales?

The biggest share of sales goes to Ford outside Ford Credit, at 93% this quarter. Ford Credit comes next, at 7.0%.

Which parts of Ford's sales drove the change over the past year?

Ford outside Ford Credit alone lost $1.10 B from a year earlier, more than the $1.01 B fall in total revenue. Ford Credit moved the other way, adding $95.00 M.

Which part of Ford's sales grew fastest over the past year?

Ford Credit grew fastest, up 2.8% from a year earlier, while total sales fell 2.0%. Its faster growth lifts its slice of the mix.

How has the mix of Ford's sales shifted over the past year?

The mix barely moved: the largest business made up 93.0% of sales this quarter, against 93.4% a year earlier.

Intelligent Insights for Lenders

How much does Ford depend on the biggest piece of its sales?

Heavily: Ford outside Ford Credit brought in 93% of these sales this quarter, against 7% for Ford Credit. A lender to Ford is leaning on the part of the company that is shrinking.

Product waitlist

Health Check and Teardown for your own company

A health check uncovers insights of your private books, not a public ticker. Join this list to get notified as soon as we go-live!