
Published · Updated Source: Form 10-Q on SEC EDGAR filed (opens in a new tab)

Key Takeaways

  • Ford Blue made 55% of sales, yet its revenue fell $939.00 M from a year earlier.
  • Ford Model e's revenue fell 31% to $1.22 B, the steepest drop of any business.
  • Ford Blue sold $11.32 B to other Ford businesses, 29% of its gross sales.
  • Ford Pro earned $5.02 of revenue for each dollar of assets assigned to it.

The Unvarnished Truth

Ford Blue shrank $939.00 M while Ford Pro quietly grew

Ford Blue is the core of Ford's sales, at $27.08 B and 55% of the total. Its revenue fell $939.00 M from a year earlier, most of the $1.01 B drop in total sales. Ford Pro moved the other way, rising to $17.77 B, or 36% of sales. The two businesses together hold most of the story, and one of them is shrinking. That single line sets the tone for the whole business mix. Its share of the total is the number most readers will remember.

Ford Model e shrank the most, its revenue down 31% to $1.22 B. Ford Blue's segment figure is larger than its outside sales, because it also counts $11.32 B sold to other Ford businesses. Those internal sales are not demand from outside customers, and they make up 29% of the gross figure. Strip them out and Ford Blue is the $27.08 B shown in the five-way breakdown. Ford Pro and Ford Credit, meanwhile, both grew, which makes the Ford Blue decline stand out.

Ford Pro brought in $5.02 of revenue for each dollar of assets assigned to it, against $0.02 for Ford Credit. That is either an efficient business or one whose assets sit elsewhere in the company. The segment assets are the only figures we have for that test. A small asset base makes a business look more productive than it may be, so the number needs a second look. If the assets sit elsewhere, how much of Ford Pro's standing comes from where its assets were booked?
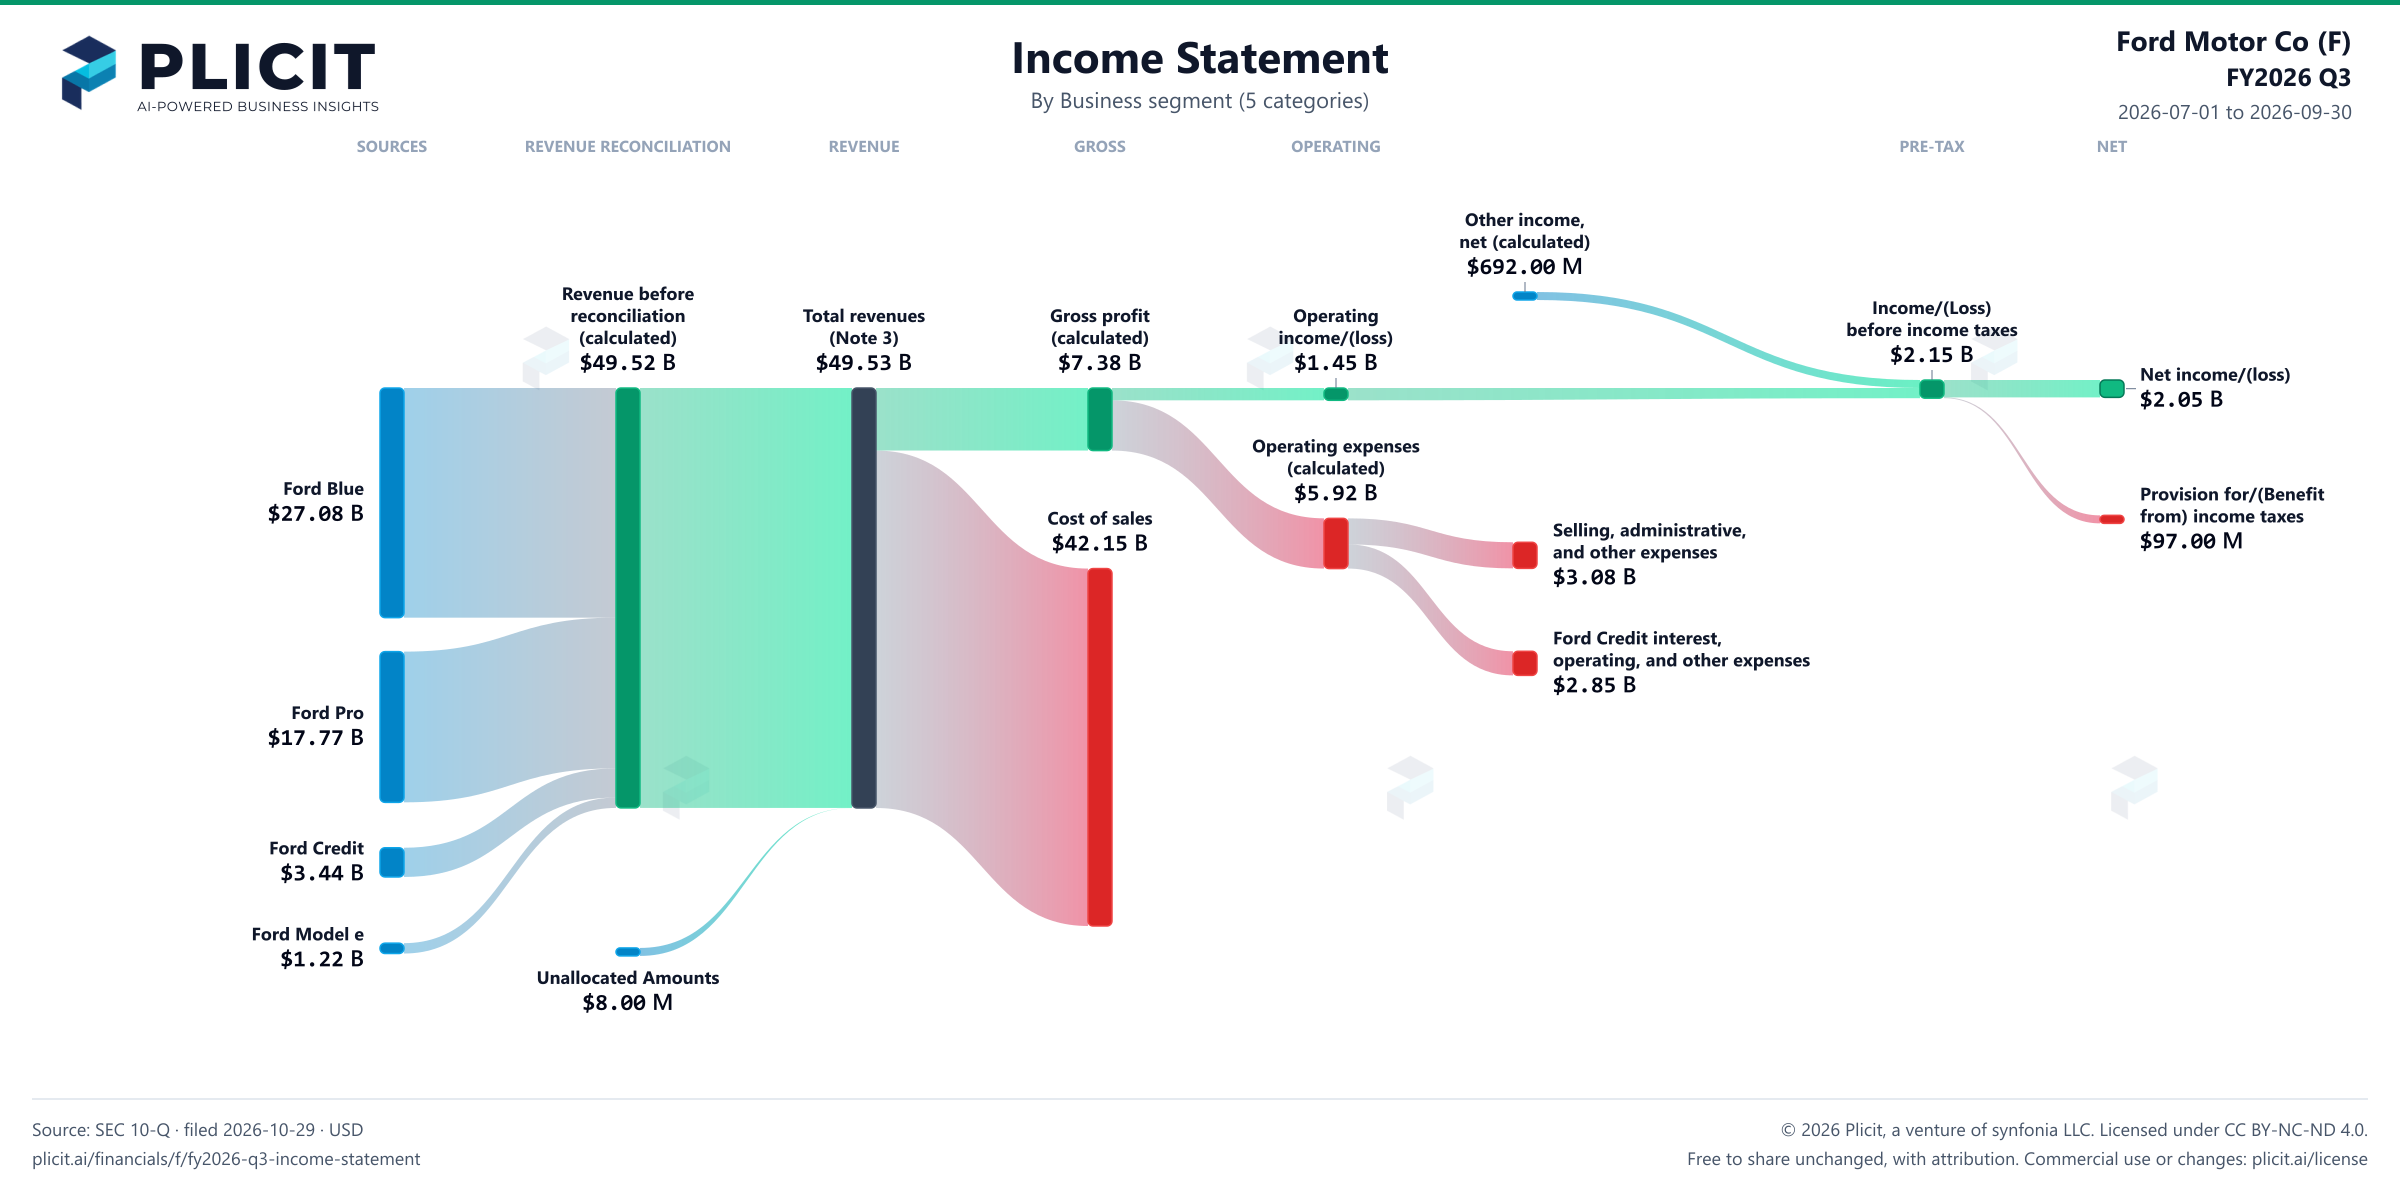
Revenue by Business Segment (5 categories)

Swipe to see the full flow
Ford Motor Co (F) FY2026 Q3 P&L / Income StatementIncome statement for 2026-07-01 through 2026-09-30. View: Business segment (5 categories). Revenue uses this breakdown; costs and expenses retain the consolidated categories.SOURCESREVENUE RECONCILIATIONREVENUEGROSSOPERATINGPRE-TAXNETFord BlueFord ProFord CreditFord Model eTotal revenues (Note 3)Revenue before reconciliation (calculated)Unallocated AmountsGross profit (calculated)Cost of salesOperating income/(loss)Operating expenses (calculated)Selling, administrative, and other expensesFord Credit interest, operating, and other expensesOther income (expense), net (calculated)Income/(Loss) before income taxesNet income/(loss)Provision for/(Benefit from) income taxesOther income (expense), net (calculated)Other income,net (calculated)$692.00 MRevenue before reconciliation (calculated)Revenue beforereconciliation(calculated)$49.52 BIncome/(Loss) before income taxesIncome/(Loss)before income taxes$2.15 BTotal revenues (Note 3)Total revenues(Note 3)$49.53 BGross profit (calculated)Gross profit(calculated)$7.38 BOperating income/(loss)Operatingincome/(loss)$1.45 BNet income/(loss)Net income/(loss)$2.05 BOperating expenses (calculated)Operating expenses(calculated)$5.92 BFord BlueFord Blue$27.08 BProvision for/(Benefit from) income taxesProvision for/(Benefitfrom) income taxes$97.00 MCost of salesCost of sales$42.15 BSelling, administrative, and other expensesSelling, administrative,and other expenses$3.08 BFord Credit interest, operating, and other expensesFord Credit interest,operating, and other expenses$2.85 BFord ProFord Pro$17.77 BFord CreditFord Credit$3.44 BFord Model eFord Model e$1.22 BUnallocated AmountsUnallocated Amounts$8.00 M
Chart details

Ford Motor Co (F) FY2026 Q3 P&L / Income Statement

Income statement for 2026-07-01 through 2026-09-30. View: Business segment (5 categories). Revenue uses this breakdown; costs and expenses retain the consolidated categories.

Total revenues (Note 3)
49,526,000,000 US dollars
Cost of sales
42,148,000,000 US dollars
Gross profit (calculated)
7,378,000,000 US dollars
Operating expenses (calculated)
5,924,000,000 US dollars
Operating income/(loss)
1,454,000,000 US dollars
Other income (expense), net (calculated)
692,000,000 US dollars
Income/(Loss) before income taxes
2,146,000,000 US dollars
Provision for/(Benefit from) income taxes
97,000,000 US dollars
Net income/(loss)
2,049,000,000 US dollars
Ford Blue
27,079,000,000 US dollars
Ford Model e
1,223,000,000 US dollars
Ford Pro
17,772,000,000 US dollars
Ford Credit
3,444,000,000 US dollars
Ford Credit interest, operating, and other expenses
2,845,000,000 US dollars
Selling, administrative, and other expenses
3,079,000,000 US dollars
Revenue before reconciliation (calculated)
49,518,000,000 US dollars. Sum of the reported revenue categories before the separately reported reconciliation.
Unallocated Amounts
8,000,000 US dollars. Reported reconciliation to consolidated revenue.

Chart connections

  • Revenue less cost of revenue equals gross profit; gross profit less operating expenses equals operating income.
  • Operating income plus other income or expense equals income before tax. Income before tax less income tax expense or benefit equals net income.
  • Reported revenue categories plus the separately reported signed reconciliation equals consolidated revenue.
Ford Motor Co (F) FY2026 Q3 Revenue by Business Segment (5 categories) Sankey chart
Free to share unchanged, with credit to Plicit.ai · CC BY-NC-ND 4.0Download PNG

Intelligent Insights for Investors

Which of Ford's businesses brings in the most sales?

Ford Blue is the top business, with 55% of sales this quarter and $27.08 B of revenue. Ford Pro is next, at 36%.

Which parts of Ford's sales drove the change over the past year?

Mostly Ford Blue: it lost $939.00 M of the $1.01 B fall in revenue from a year earlier. Ford Pro moved the other way, adding revenue.

Which business lost the most ground over the past year?

Ford Model e: its revenue fell 31% from a year earlier, while revenue as a whole fell 2.0%.

Intelligent Insights for Lenders

Which business earns the most sales for each dollar of assets?

Ford Pro earned $5.02 of revenue for each dollar of assets assigned to it, against $0.02 at Ford Credit. A lender should ask whether assigned assets capture everything that backs the business.

Product waitlist

Health Check and Teardown for your own company

A health check uncovers insights of your private books, not a public ticker. Join this list to get notified as soon as we go-live!