
Diamondback Energy, Inc. (FANG) FY2024 Q3 Balance Sheet
As of 2024-09-30
Balance Sheet
As of 2024-09-30
Swipe to see the full flow
Chart details
Diamondback Energy, Inc. (FANG) FY2024 Q3 Balance Sheet
Balance sheet as of 2024-09-30. The chart shows assets, liabilities and equity at that date.
- Assets
- 65,747,000,000 US dollars
- Current assets
- 2,022,000,000 US dollars
- Non-current assets
- 63,725,000,000 US dollars
- Liabilities
- 26,928,000,000 US dollars
- Current liabilities
- 4,463,000,000 US dollars
- Non-current liabilities
- 22,465,000,000 US dollars
- Equity
- 38,819,000,000 US dollars
- Noncontrolling interest
- 1,390,000,000 US dollars. Included in consolidated equity; this amount is not added again.
- Oil and natural gas properties, full cost method of accounting ($21,971 million and $8,659 million excluded from amortization at September 30, 2024 and December 31, 2023, respectively) ($4,771 million and $4,629 million related to Viper and $1,623 million and $1,769 million excluded from amortization related to Viper)
- 79,718,000,000 US dollars. Part of Property and equipment, net, drawn as one net amount.
- Other property, equipment and land
- 1,417,000,000 US dollars. Part of Property and equipment, net, drawn as one net amount.
- Accumulated depletion, depreciation, amortization and impairment ($1,016 million and $866 million related to Viper)
- negative 18,082,000,000 US dollars. Part of Property and equipment, net, drawn as one net amount.
- Oil and natural gas sales, net ($109 million and $109 million related to Viper)
- 1,197,000,000 US dollars
- Cash and cash equivalents
- 370,000,000 US dollars
- Joint interest and other, net
- 233,000,000 US dollars
- Inventories
- 126,000,000 US dollars
- Prepaid expenses and other current assets
- 51,000,000 US dollars
- Derivative instruments
- 42,000,000 US dollars
- Restricted cash
- 3,000,000 US dollars
- Property and equipment, net
- 63,053,000,000 US dollars
- Equity method investments
- 377,000,000 US dollars
- Investment in real estate, net
- 81,000,000 US dollars
- Other assets
- 71,000,000 US dollars
- Deferred income taxes, net
- 62,000,000 US dollars
- Funds held in escrow
- 43,000,000 US dollars
- Derivative instruments
- 38,000,000 US dollars
- Revenues and royalties payable
- 1,444,000,000 US dollars
- Current maturities of debt
- 1,000,000,000 US dollars
- Other accrued liabilities
- 857,000,000 US dollars
- Accrued capital expenditures
- 641,000,000 US dollars
- Income taxes payable
- 289,000,000 US dollars
- Accounts payable - trade
- 198,000,000 US dollars
- Derivative instruments
- 34,000,000 US dollars
- Long-term debt ($822 million and $1,083 million related to Viper)
- 11,923,000,000 US dollars
- Deferred income taxes
- 9,952,000,000 US dollars
- Asset retirement obligations
- 493,000,000 US dollars
- Derivative instruments
- 79,000,000 US dollars
- Other long-term liabilities
- 18,000,000 US dollars
- Additional paid-in capital
- 34,007,000,000 US dollars
- Retained earnings (accumulated deficit)
- 3,427,000,000 US dollars
- Common stock, $0.01 par value; 800,000,000 shares authorized; 292,742,664 and 178,723,871 shares issued and outstanding at September 30, 2024 and December 31, 2023, respectively
- 3,000,000 US dollars
- Non-controlling interest
- 1,390,000,000 US dollars
- Accumulated other comprehensive income (loss)
- negative 8,000,000 US dollars
- Gross equity (calculated)
- 38,827,000,000 US dollars. Net equity plus the magnitudes of its negative contributions equals gross positive equity. The negative contributions enter this reconciliation as add-backs; their filed signs stay negative.
Chart connections
- Assets equal liabilities plus consolidated equity. Consolidated equity includes noncontrolling interests when reported.
- Treasury shares and other negative equity contributions reduce equity.
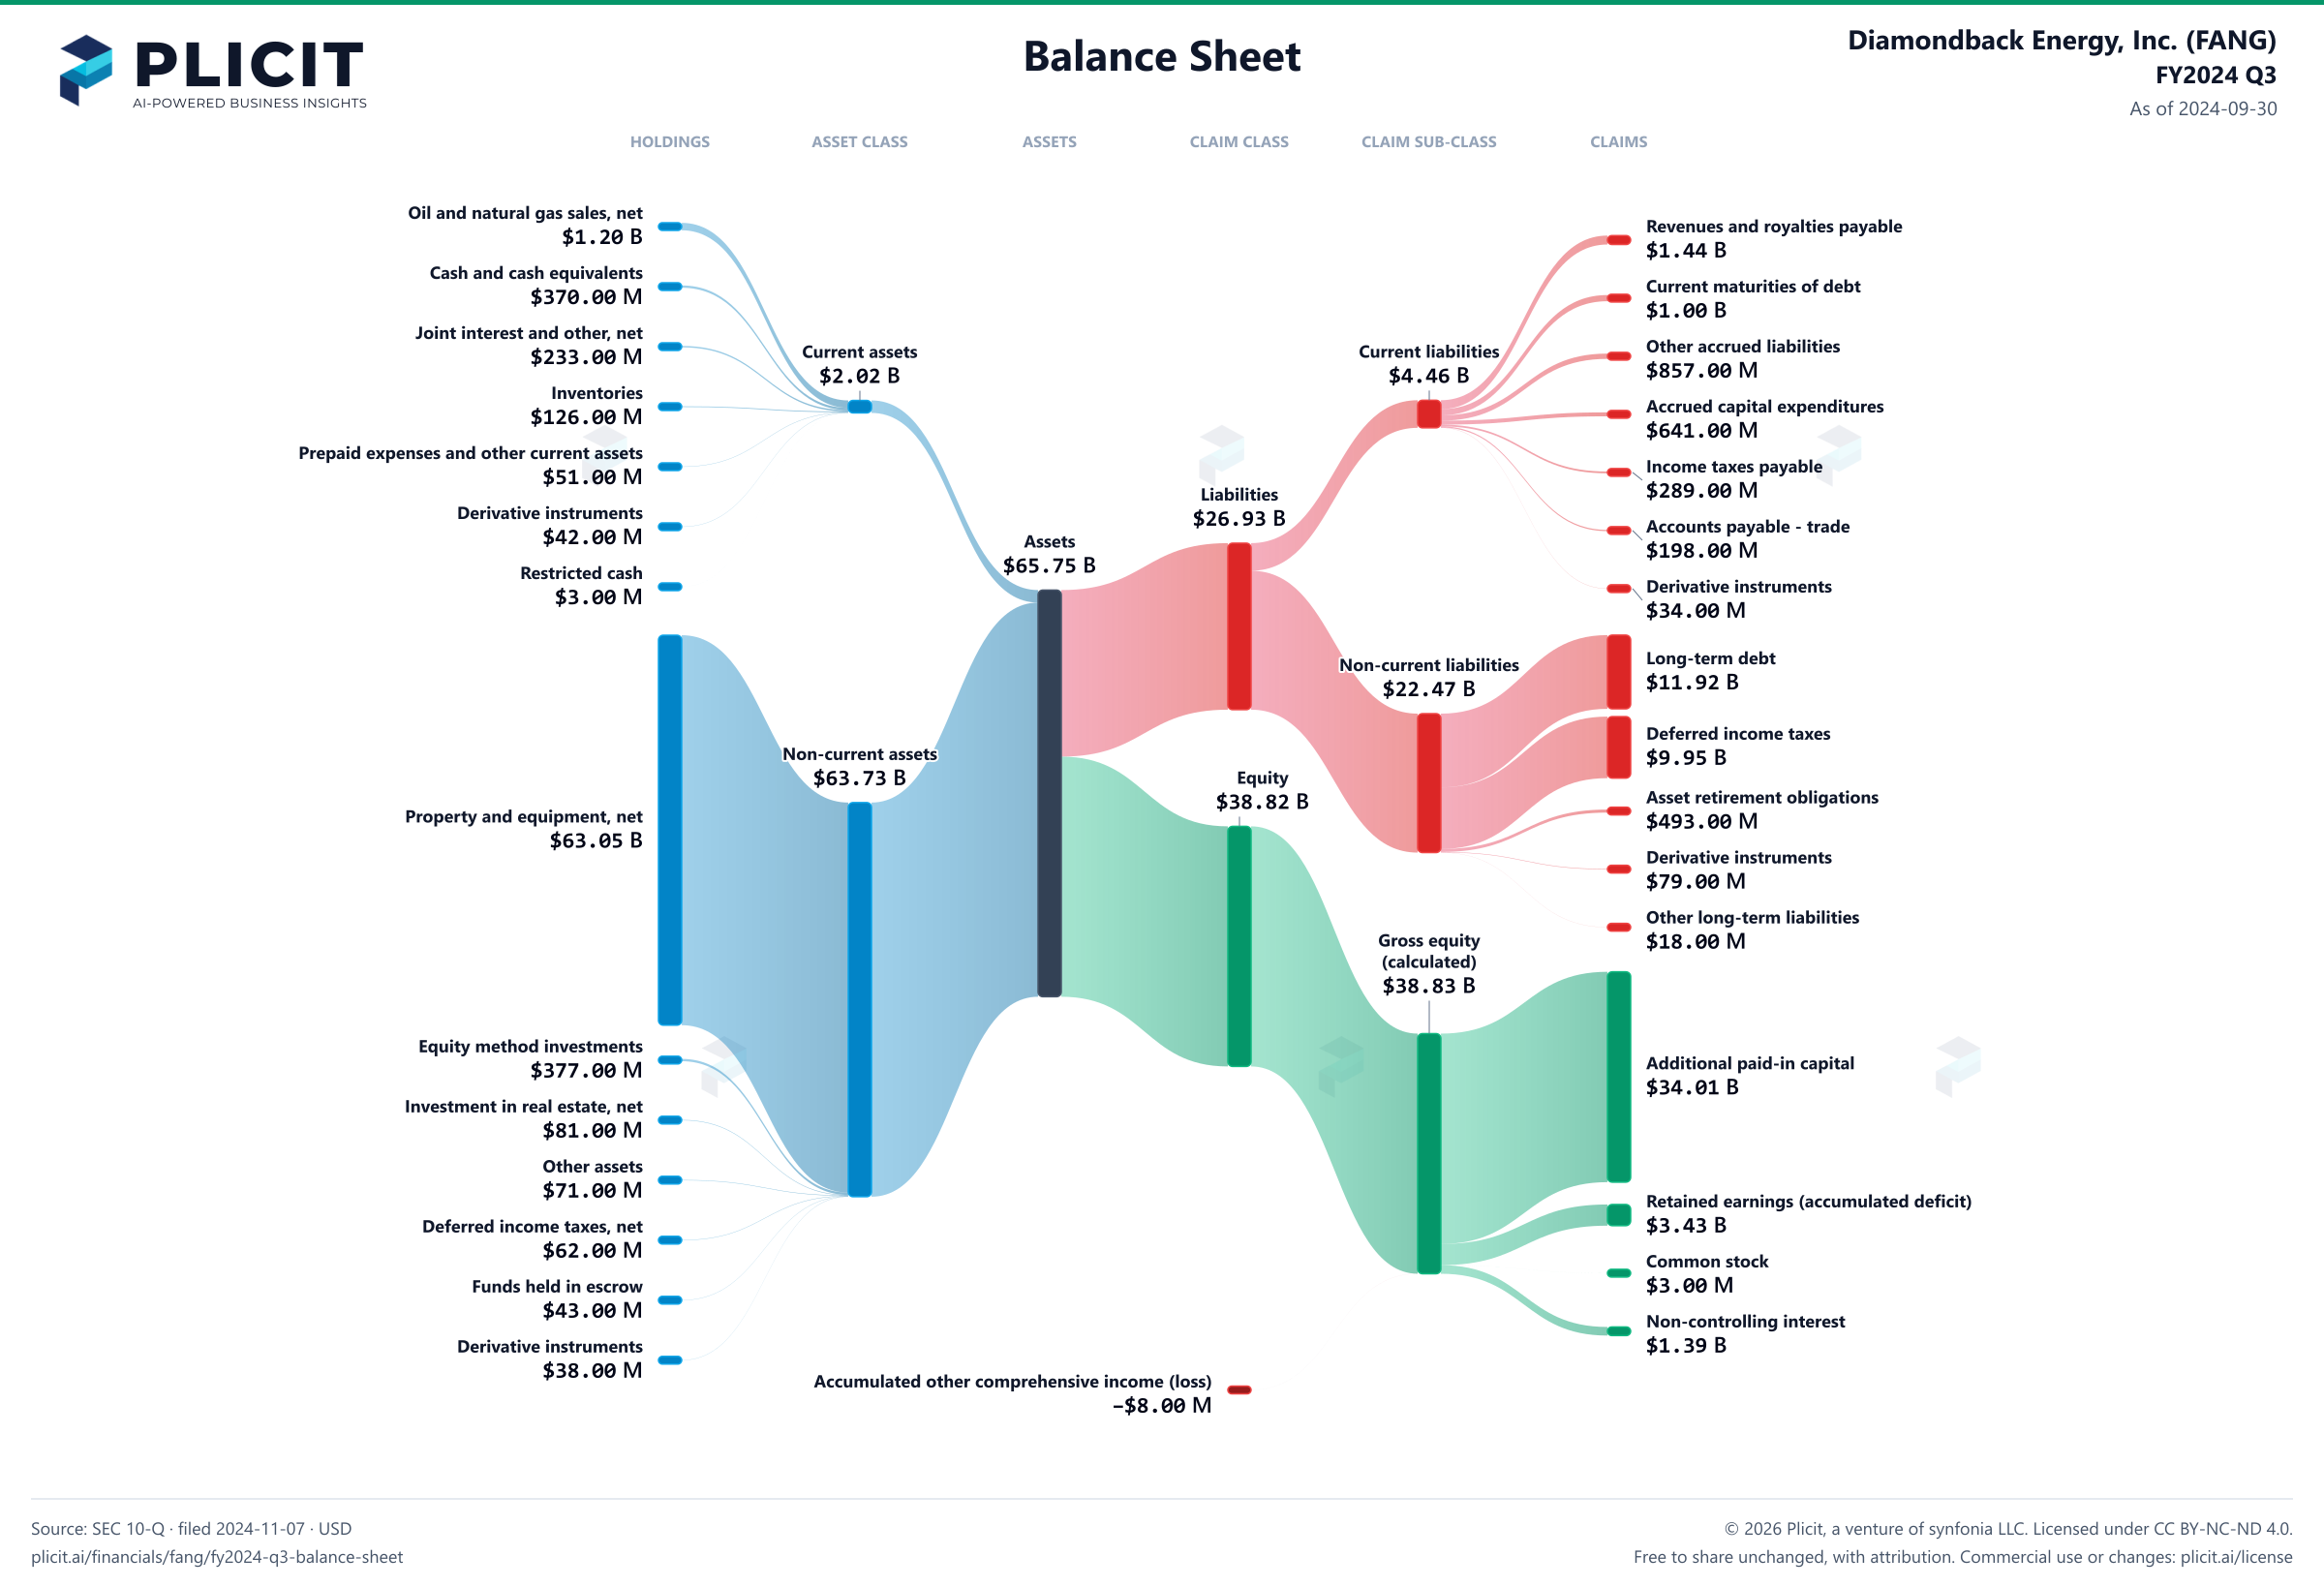
Free to share unchanged, with credit to Plicit.ai · CC BY-NC-ND 4.0Download PNG
Product waitlist
Health Check and Teardown for your own company
A health check uncovers insights of your private books, not a public ticker. Join this list to get notified as soon as we go-live!