THE GREENBRIER COMPANIES, INC. (GBX) FY2026 Annual Statement of Cash Flows

Published · Updated Source: Form 10-K on SEC EDGAR filed (opens in a new tab)

Key Takeaways

  • Operations brought in $39.60 M of cash, down 85% from $265.70 M a year earlier.
  • Equipment spending of $279.30 M ran $239.70 M ahead of the cash operations produced.
  • Only 49 cents of each dollar of profit arrived as cash, against $81.60 M of profit.
  • Net new borrowing of $92.20 M and $192.80 M of asset sales kept the cash balance afloat.
  • Dividends and buybacks took another $56.00 M that operations had not earned in cash.

The Unvarnished Truth

Greenbrier cash from operations fell 85% as debt filled the gap

Greenbrier operations brought in just $39.60 M of cash in the year to August 31, 2026, down 85% from $265.70 M. Over the same year it spent $279.30 M on property and equipment, leaving a $239.70 M hole before a single dividend. It paid $56.00 M to shareholders in dividends and buybacks anyway. Sales fell 24%, but cash fell far harder, and each dollar of the $81.60 M profit turned into only 49 cents of cash. So where did the money go, and who covered the gap?

Management points to "a $79.2 million net change in working capital accounts, primarily Inventories." The cash flow statement shows inventories absorbing $106.7 million, while deliveries fell 31.9%. Management says its capital expenditures "primarily relate to additions to our lease fleet." Proceeds from asset sales jumped to $192.80 M from $77.30 M, mostly "sales of railcars from our lease fleet." Those sales booked a $38.4 million gain, profit earned by shrinking the fleet rather than running it. The rest of the gap came from lenders: net new borrowing of $92.20 M.

For investors, the question is whether this was a pause or a squeeze. Management expects net capital spending of about $225 million to $275 million in 2027, far more than operations brought in this year. Debt of $181.70 M also falls due within a year. Watch the backlog, which fell to 14,000 railcars from 16,600, and the inventory line: if railcars ship and inventory unwinds, cash comes back. If not, can Greenbrier keep funding its fleet and its dividend without leaning ever harder on its lenders?

2025-09-01 to 2026-08-31

Statement of Cash Flows

Swipe to see the full flow
THE GREENBRIER COMPANIES, INC. cash flow reconciliation, Sep 1, 2025 through Aug 31, 2026One connected Sankey reconciles operating, investing and financing net cash flows through a shared cash pool, from beginning cash to ending cash. Ribbons flow left to right on one dollar scale. Activity totals are dark gray; beginning and ending cash are blue. Cash basis for beginning and ending balances and net cash change: Cash, cash equivalents, and restricted cash. Intermediate calculation bars are lighter gray. Net income is green for profit and red for loss. Identified asset purchases, sales and maturities are blue in either cash direction. Orange marks positive customer-advance and deferred-revenue changes that add to operating cash in the reconciliation. These are net changes, not gross customer receipts. Negative changes are neutral reconciliation adjustments; they do not by themselves identify cash payments. Purple identifies capital transactions such as borrowing, repayments, share issuance and dividends. Free cash flow is a separate comparison, not an added cash flow. Read chart description and values below for full signed amounts, including zero items.Net earnings → Net cash from operating activities: $39,600,000.00Net earnings → Operating adjustments reconciliation: $42,000,000.00Depreciation and amortization → Operating adjustments reconciliation: $130,300,000.00Accounts receivable, net → Operating adjustments reconciliation: $32,100,000.00Other assets → Operating adjustments reconciliation: $30,300,000.00Deferred revenue → Operating adjustments reconciliation: $21,300,000.00Stock based compensation expense → Operating adjustments reconciliation: $15,500,000.00Income tax receivable → Operating adjustments reconciliation: $14,800,000.00Deferred income taxes → Operating adjustments reconciliation: $12,500,000.00Operating adjustments reconciliation → Inventories: $106,700,000.00Operating adjustments reconciliation → Leased railcars for syndication: $97,400,000.00Operating adjustments reconciliation → Net loss (gain) on disposition of equipment: $38,400,000.00Operating adjustments reconciliation → Accounts payable and accrued liabilities: $28,800,000.00Operating adjustments reconciliation → Earnings from unconsolidated affiliates: $20,400,000.00Operating adjustments reconciliation → Noncontrolling interest adjustments: $5,800,000.00Operating adjustments reconciliation → Other: $1,300,000.00Proceeds from sales of assets → investing reconciliation: $192,800,000.00investing reconciliation → Capital expenditures: $279,300,000.00investing reconciliation → Other: $4,600,000.00Net cash used in financing activities → financing reconciliation: $31,300,000.00Proceeds from debt with maturities longer than 90 days → financing reconciliation: $675,000,000.00Net changes in debt with maturities of 90 days or less → financing reconciliation: $60,000,000.00financing reconciliation → Repayments of debt with maturities longer than 90 days: $642,800,000.00financing reconciliation → Cash distribution to joint venture partner: $49,800,000.00financing reconciliation → Dividends: $42,600,000.00financing reconciliation → Repurchase of stock, including excise tax: $13,400,000.00financing reconciliation → Debt issuance costs: $9,200,000.00financing reconciliation → Tax payments for net share settlement of restricted stock: $8,500,000.00Net cash used in investing activities → investing reconciliation: $91,100,000.00Exchange-rate effect → Cash sources and uses: $13,600,000.00Beginning cash: Cash, cash equivalents, and restricted cash → Cash sources and uses: $326,400,000.00Net cash from operating activities → Cash sources and uses: $39,600,000.00Cash sources and uses → Ending cash: Cash, cash equivalents, and restricted cash: $257,200,000.00Cash sources and uses → Net cash used in investing activities: $91,100,000.00Cash sources and uses → Net cash used in financing activities: $31,300,000.00Net earnings: $81,600,000.00Net earnings+$81.60 MDeferred income taxes: $12,500,000.00Deferred income taxes+$12.50 MDepreciation and amortization: $130,300,000.00Depreciation & amortization+$130.30 MNet loss (gain) on disposition of equipment: -$38,400,000.00Other asset gain & loss−$38.40 MStock based compensation expense: $15,500,000.00Stock-based compensation+$15.50 MEarnings from unconsolidated affiliates: -$20,400,000.00Equity-method results−$20.40 MNoncontrolling interest adjustments: -$5,800,000.00Noncontrolling interest adjustments−$5.80 MOther: -$1,300,000.00Other operating, net−$1.30 MAccounts receivable, net: $32,100,000.00Accounts receivable+$32.10 MIncome tax receivable: $14,800,000.00Income taxes receivable+$14.80 MInventories: -$106,700,000.00Inventories−$106.70 MLeased railcars for syndication: -$97,400,000.00Leased railcars for syndication−$97.40 MOther assets: $30,300,000.00Other operating assets+$30.30 MAccounts payable and accrued liabilities: -$28,800,000.00Payables & accrued liabilities−$28.80 MDeferred revenue: $21,300,000.00Deferred revenue+$21.30 MNet cash from operating activities: $39,600,000.00Operating cash+$39.60 MOperating adjustments reconciliation: $298,800,000.00Net changes in debt with maturities of 90 days or less: $60,000,000.00Short-term debt ≤3 months, net+$60.00 MProceeds from debt with maturities longer than 90 days: $675,000,000.00Short-term debt issued, 90+ days+$675.00 MRepayments of debt with maturities longer than 90 days: -$642,800,000.00Short-term debt repaid, 90+ days−$642.80 MDebt issuance costs: -$9,200,000.00Debt issuance costs−$9.20 MRepurchase of stock, including excise tax: -$13,400,000.00Common stock repurchases−$13.40 MDividends: -$42,600,000.00Dividends paid−$42.60 MCash distribution to joint venture partner: -$49,800,000.00Distributions to affiliates−$49.80 MTax payments for net share settlement of restricted stock: -$8,500,000.00Stock-award tax withholding−$8.50 MNet cash used in financing activities: -$31,300,000.00. Cash required to fund net payments.Financing cash−$31.30 Mfinancing reconciliation: $766,300,000.00Proceeds from sales of assets: $192,800,000.00PP&E sales+$192.80 MCapital expenditures: -$279,300,000.00Capital expenditures−$279.30 MOther: -$4,600,000.00Other investing, net−$4.60 MNet cash used in investing activities: -$91,100,000.00. Cash required to fund net payments.Investing cash−$91.10 Minvesting reconciliation: $283,900,000.00Cash sources and uses: $379,600,000.00Beginning cash: Cash, cash equivalents, and restricted cash: $326,400,000.00Beginning cash$326.40 MEnding cash: Cash, cash equivalents, and restricted cash: $257,200,000.00Ending cash$257.20 MExchange-rate effect: $13,600,000.00FX effect+$13.60 MCASH RECONCILIATIONOperatingflowsInvestingflowsFinancingflowsFree cash flow−$239.70 MOperating cash − cash spent on productive assetsCash flow / Net income0.49×Operating cash flow ÷ net incomeNet cash change−$69.20 MEnding cash − beginning cash
Chart details

THE GREENBRIER COMPANIES, INC. cash flow reconciliation, Sep 1, 2025 through Aug 31, 2026

Cash flows for Sep 1, 2025 through Aug 31, 2026. Cash basis: Cash, cash equivalents, and restricted cash. Beginning cash: Aug 31, 2025. Ending cash: Aug 31, 2026. Beginning and ending cash are dated balances. Positive cash flows add cash; negative cash flows reduce it.

Beginning cash on Aug 31, 2025
326,400,000 US dollars. Beginning cash: Cash, cash equivalents, and restricted cash
Operating activities
39,600,000 US dollars. Net cash provided.
Net earnings
81,600,000 US dollars
Deferred income taxes
12,500,000 US dollars
Depreciation and amortization
130,300,000 US dollars
Net loss (gain) on disposition of equipment
negative 38,400,000 US dollars
Stock based compensation expense
15,500,000 US dollars
Earnings from unconsolidated affiliates
negative 20,400,000 US dollars
Noncontrolling interest adjustments
negative 5,800,000 US dollars
Other
negative 1,300,000 US dollars
Accounts receivable, net
32,100,000 US dollars
Income tax receivable
14,800,000 US dollars
Inventories
negative 106,700,000 US dollars
Leased railcars for syndication
negative 97,400,000 US dollars
Other assets
30,300,000 US dollars
Accounts payable and accrued liabilities
negative 28,800,000 US dollars
Deferred revenue
21,300,000 US dollars
Investing activities
negative 91,100,000 US dollars. Net cash used.
Proceeds from sales of assets
192,800,000 US dollars
Capital expenditures
negative 279,300,000 US dollars
Other
negative 4,600,000 US dollars
Financing activities
negative 31,300,000 US dollars. Net cash used.
Net changes in debt with maturities of 90 days or less
60,000,000 US dollars
Proceeds from debt with maturities longer than 90 days
675,000,000 US dollars
Repayments of debt with maturities longer than 90 days
negative 642,800,000 US dollars
Debt issuance costs
negative 9,200,000 US dollars
Repurchase of stock, including excise tax
negative 13,400,000 US dollars
Dividends
negative 42,600,000 US dollars
Cash distribution to joint venture partner
negative 49,800,000 US dollars
Tax payments for net share settlement of restricted stock
negative 8,500,000 US dollars
Operating adjustment reconciliation
298,800,000 US dollars. Intermediate calculation joining the operating reconciliation branches. Its gross amount includes any portion of net income routed through this junction. It is not an additional cash source or use.
financing gross reconciliation
766,300,000 US dollars. Gross amount at the activity's junction before offsetting its receipts and deductions. It is not an additional cash source or use.
investing gross reconciliation
283,900,000 US dollars. Gross amount at the activity's junction before offsetting its receipts and deductions. It is not an additional cash source or use.
Exchange-rate effect
13,600,000 US dollars
Ending cash on Aug 31, 2026
257,200,000 US dollars. Ending cash: Cash, cash equivalents, and restricted cash
Cash sources and uses
379,600,000 US dollars. Opening cash plus net sources, equal to net uses plus ending cash.
Net cash change
negative 69,200,000 US dollars. Ending cash minus beginning cash.
Cash flow / Net income
0.49×. Operating cash flow divided by reconciliation net income for the same period. Black from 0.90× through 1.10×; green above 1.10×; red below 0.90×. Color uses the unrounded ratio.
Operating cash flow
39,600,000 US dollars. Operating cash flow used in the free cash flow calculation.
cash spent on productive assets
279,300,000 US dollars. These cash purchases are already included in investing activities above.
Free cash flow
negative 239,700,000 US dollars. A supplemental measure; finance-lease payments are excluded from this definition.

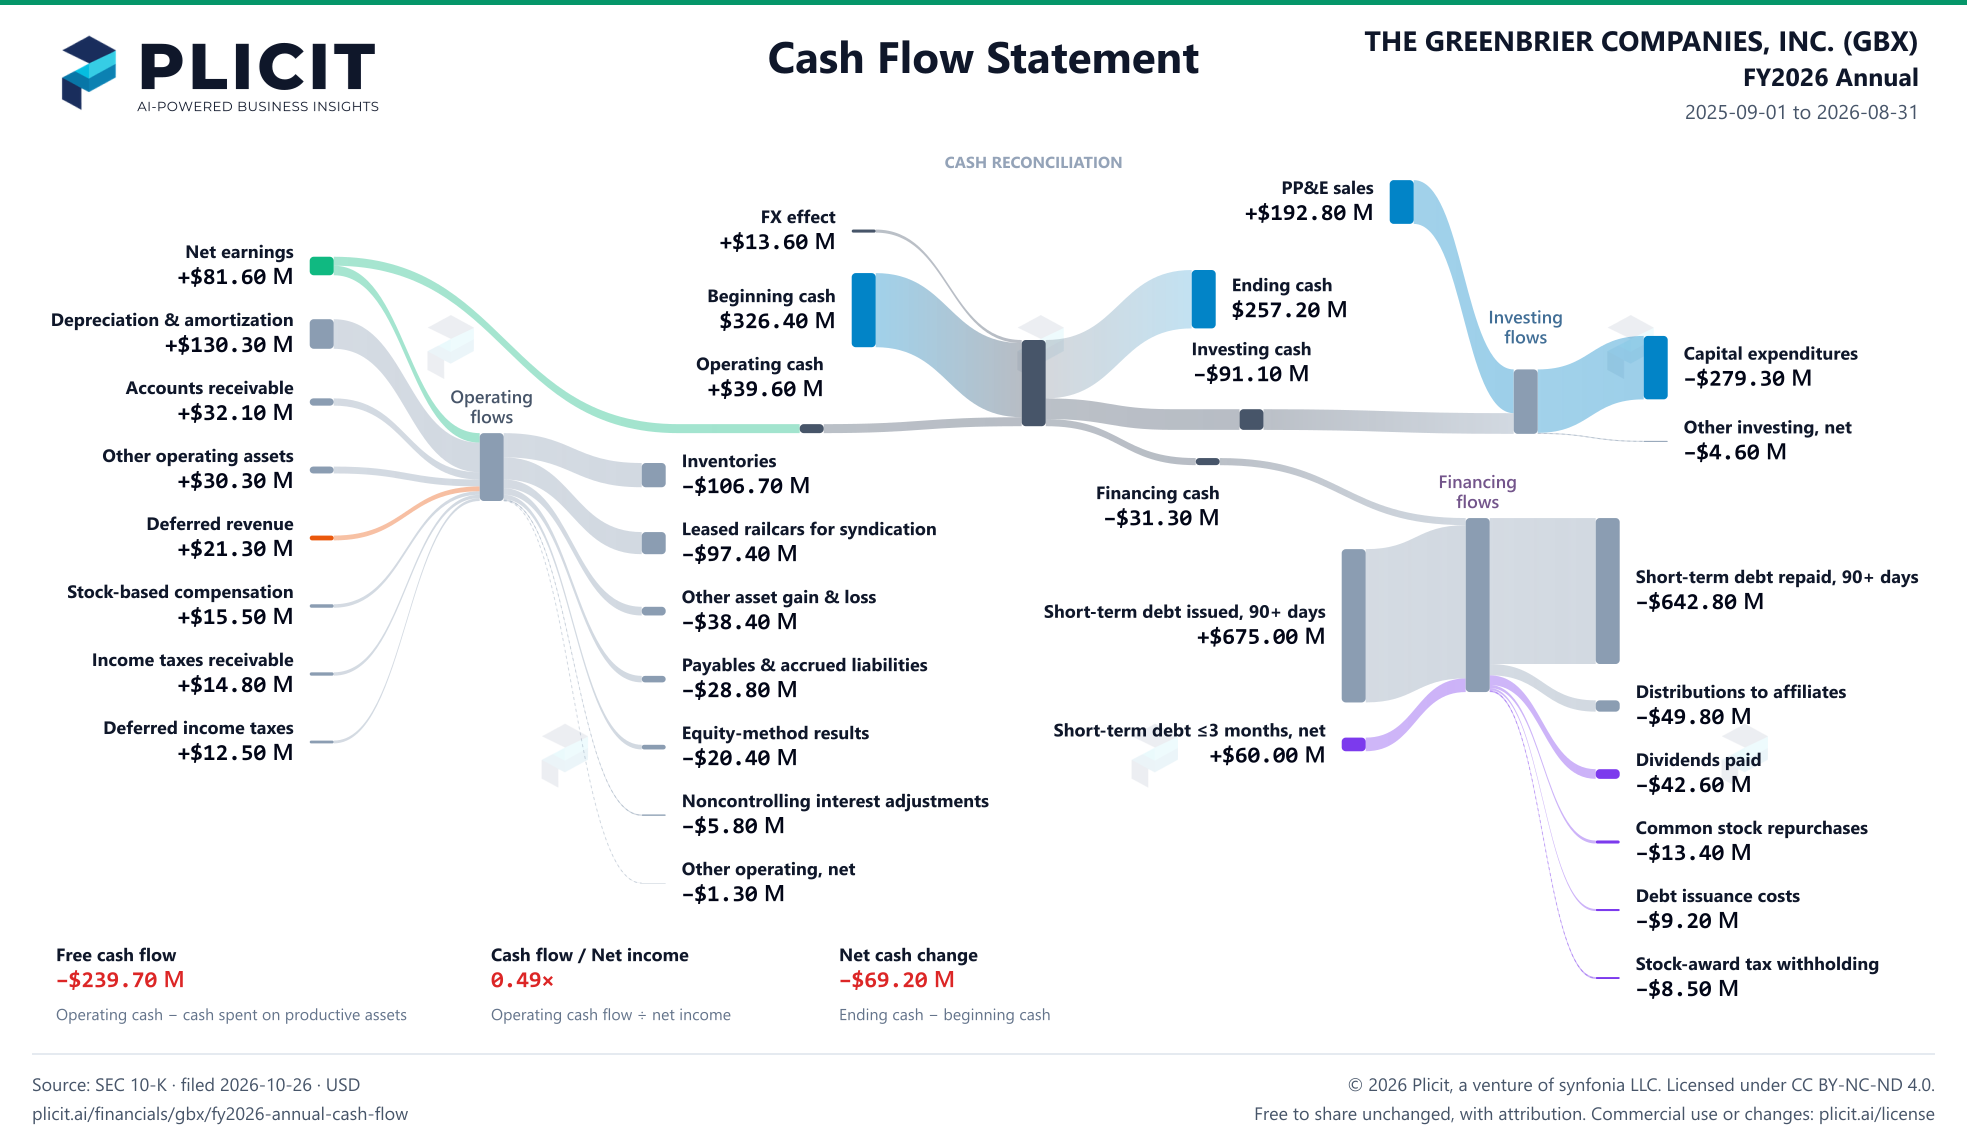
Chart connections

  • Beginning cash plus operating, investing and financing cash flows plus the exchange-rate effect equals ending cash. Negative amounts reduce cash.
  • Financing contributions meet at a reconciliation junction before connecting to the net cash total.
  • Investing contributions meet at a reconciliation junction before connecting to the net cash total.
  • Operating reconciliation adjustments are not all independent cash receipts.
  • Net income exceeds operating cash. The diagram allocates $39.60M of net income directly to operating cash and $42.00M to the adjustment junction, where it combines with other additions to reconcile deductions. This is an accounting presentation, not a tracing of cash receipts.
  • Each activity has one net cash bar connected to the shared cash pool. Positive activity totals enter the pool; negative activity totals leave the pool to fund that activity's net payments. The central pool does not assign a particular funding source to a particular payment.
  • The intermediate calculation bars include both sides of the displayed activity breakdowns; they are not additional cash flows.
  • Operating cash flow minus cash spent on productive assets equals free cash flow: 39,600,000 US dollars minus 279,300,000 US dollars equals negative 239,700,000 US dollars.
THE GREENBRIER COMPANIES, INC. (GBX) FY2026 Annual Statement of Cash Flows Sankey chart
Free to share unchanged, with credit to Plicit.ai · CC BY-NC-ND 4.0Download PNG

Intelligent Insights for Investors

Is Greenbrier bringing in more cash from operations than a year ago?

No: operations brought in $39.60 M this year, down 85% from $265.70 M a year earlier. Profit fell too, to $81.60 M from $213.10 M.

How much cash did Greenbrier have left after investing in its business?

None: its $279.30 M of spending on property and equipment this year was $239.70 M more than its operations brought in. Every dollar of that gap had to come from asset sales, borrowing or the cash pile.

Did Greenbrier cash after capital spending cover dividends and buybacks?

Nothing was left to cover them. Greenbrier still paid $42.60 M in dividends and $13.40 M in buybacks, $56.00 M in all.

Intelligent Insights for Lenders

Is Greenbrier borrowing more or paying down debt?

It switched to borrowing: new debt beat repayments by $92.20 M this year, where a year earlier it paid down a net $10.40 M.

How much did Greenbrier borrow and repay during the year?

A lot: Greenbrier raised $675.00 M of new debt this year and repaid $642.80 M. The cash flows do not show which loans were refinanced.

Product waitlist

Health Check and Teardown for your own company

A health check uncovers insights of your private books, not a public ticker. Join this list to get notified as soon as we go-live!