
Masco Corporation (MAS) FY2026 Q3 P&L / Income Statement

Published · Updated Source: Form 10-Q on SEC EDGAR filed (opens in a new tab)

Key Takeaways

  • North America supplied $1.58 B of sales this quarter, 80% of the company's total.
  • International sales fell 5.2% from a year earlier, to $384.00 M, while the total rose 2.6%.
  • Foreign subsidiaries held $273.00 M of the $610.00 M in cash at quarter end.
  • North America grew 5%, from $1.51 B to $1.58 B, and carried the whole increase.

The Unvarnished Truth

North America brings in 80% of sales, and International is shrinking

North America is the business, and International is quietly getting smaller. North America supplied $1.58 B this quarter, 80% of sales. International supplied $384.00 M, down $21.00 M from $405.00 M a year earlier. North America added $70.00 M, more than the company's whole $49.00 M rise. The company says lower sales volume in International plumbing products explains part of the drop. Is International shrinking because of customers, currency or tariffs?

Why is International falling while the company grows? The company says lower volume in decorative products and International plumbing cut sales by two percent. It also says higher North America plumbing volume added two percent to sales. International's share fell from 21% a year earlier to 20%. Cash held abroad matters here: $273.00 M of the company's cash sat in foreign subsidiaries at quarter end. Will International keep shrinking while North America carries the growth?

North America's dominance is a strength in its home market and a concentration risk. Of the $610.00 M of cash at quarter end, $273.00 M sat in foreign subsidiaries, 45% of the total. The filing gives no currency split of those foreign balances. If International keeps shrinking, will North America's growth be enough to hold up the company's sales? Does a shrinking International business and a large foreign cash balance make the home market matter more?
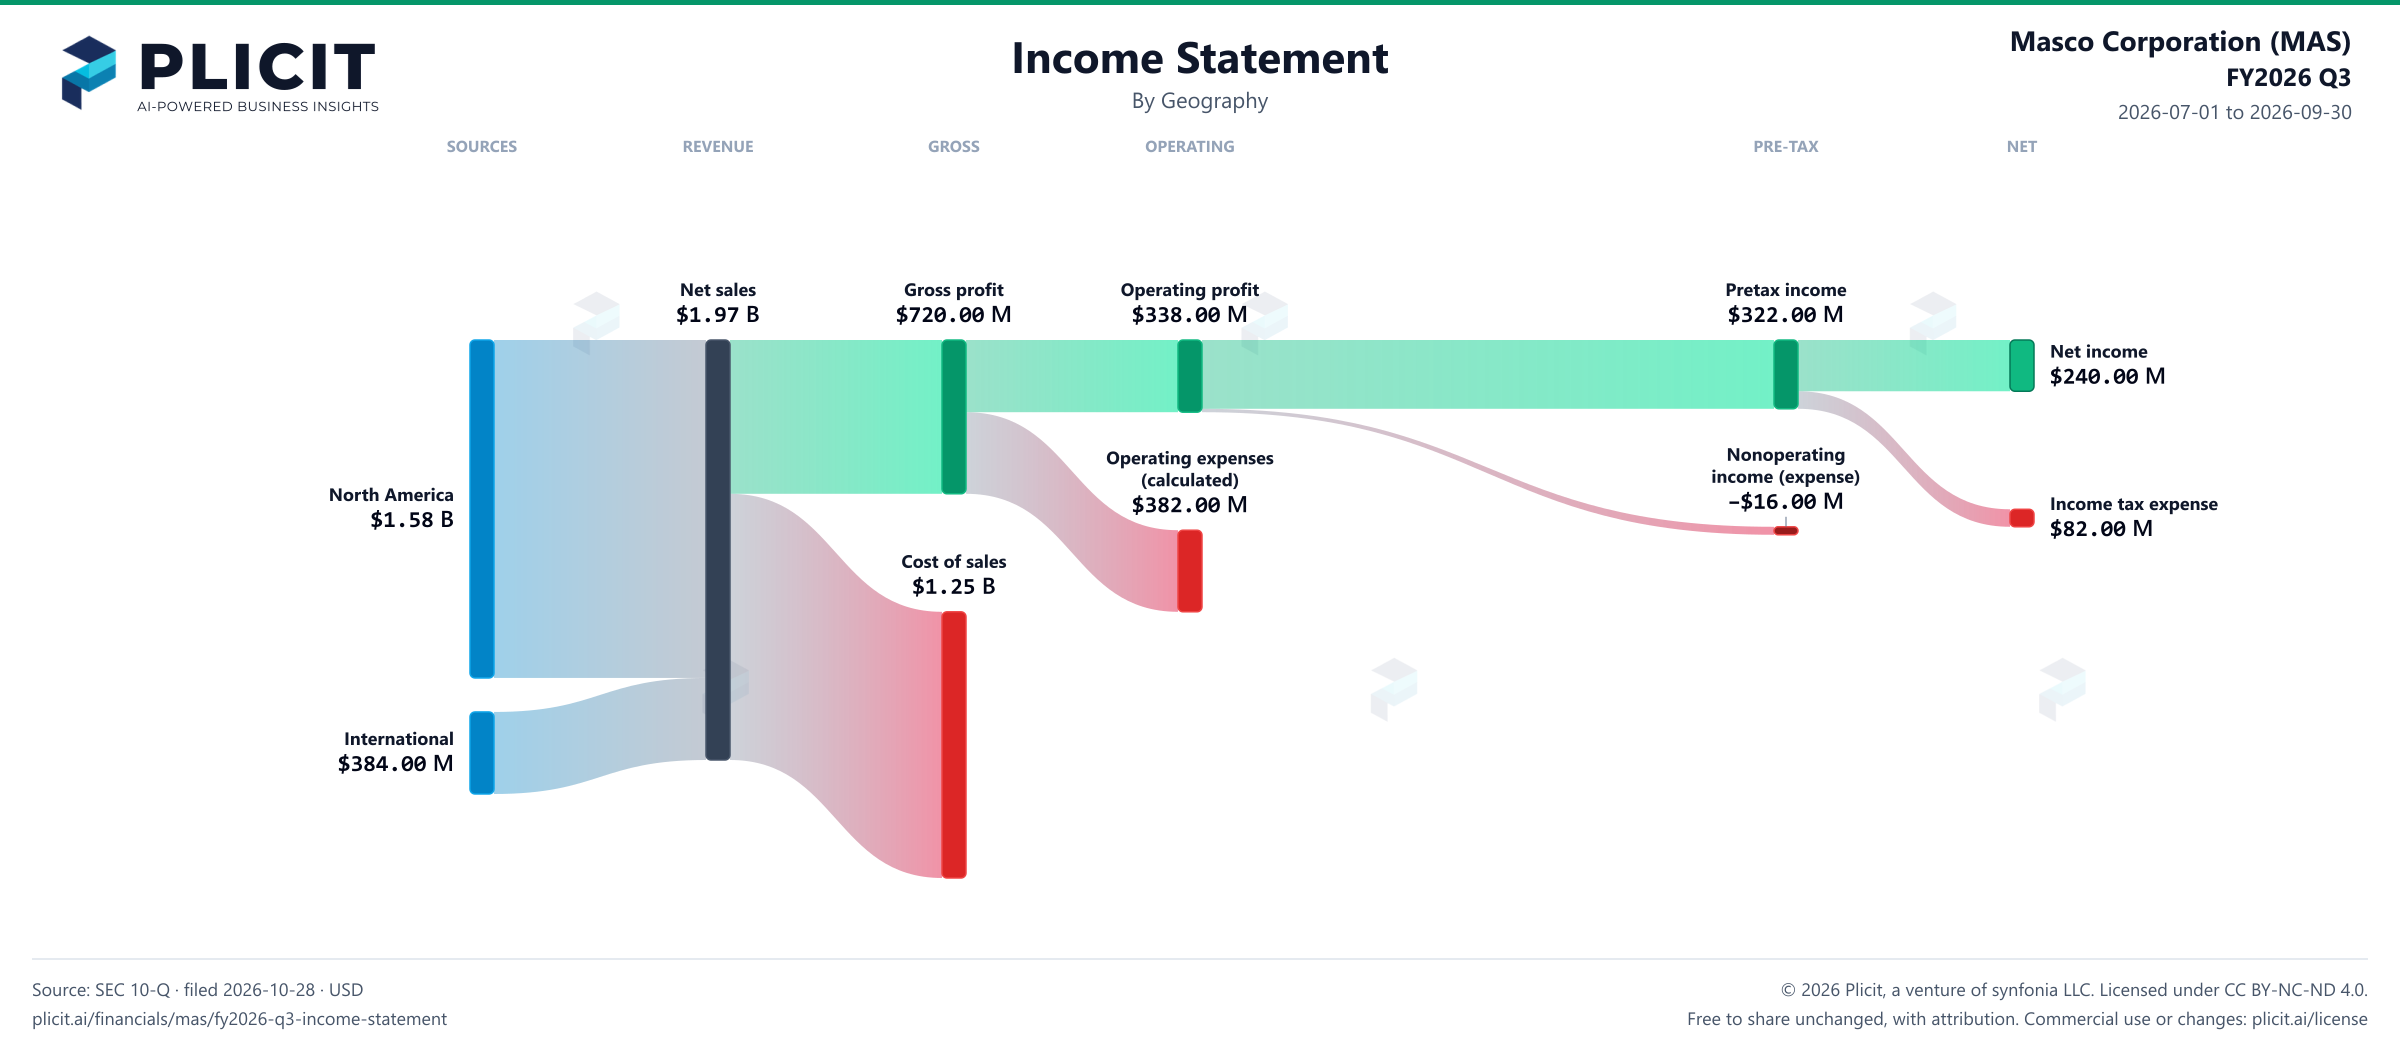
Revenue by Geography

Swipe to see the full flow
Masco Corporation (MAS) FY2026 Q3 P&L / Income StatementIncome statement for 2026-07-01 through 2026-09-30. View: Geography. Revenue uses this breakdown; costs and expenses retain the consolidated categories.SOURCESREVENUEGROSSOPERATINGPRE-TAXNETNorth AmericaInternationalNet salesGross profitCost of salesOperating profitOperating expenses (calculated)Income before income taxesNonoperating income (expense)Net incomeIncome tax expenseNet salesNet sales$1.97 BGross profitGross profit$720.00 MOperating profitOperating profit$338.00 MIncome before income taxesPretax income$322.00 MNet incomeNet income$240.00 MOperating expenses (calculated)Operating expenses(calculated)$382.00 MNorth AmericaNorth America$1.58 BIncome tax expenseIncome tax expense$82.00 MNonoperating income (expense)Nonoperatingincome (expense)−$16.00 MCost of salesCost of sales$1.25 BInternationalInternational$384.00 M
Chart details

Masco Corporation (MAS) FY2026 Q3 P&L / Income Statement

Income statement for 2026-07-01 through 2026-09-30. View: Geography. Revenue uses this breakdown; costs and expenses retain the consolidated categories.

Net sales
1,966,000,000 US dollars
Cost of sales
1,246,000,000 US dollars
Gross profit
720,000,000 US dollars
Operating expenses (calculated)
382,000,000 US dollars
Operating profit
338,000,000 US dollars
Nonoperating income (expense)
negative 16,000,000 US dollars
Income before income taxes
322,000,000 US dollars
Income tax expense
82,000,000 US dollars
Net income
240,000,000 US dollars
North America
1,582,000,000 US dollars
International
384,000,000 US dollars
Selling, general and administrative expenses
381,000,000 US dollars. Source detail retained; this breakdown has not reconciled exactly and is not drawn.

Chart connections

  • Revenue less cost of revenue equals gross profit; gross profit less operating expenses equals operating income.
  • Operating income plus other income or expense equals income before tax. Income before tax less income tax expense or benefit equals net income.
  • Of which attributable to Masco Corporation: $230.00 M; to noncontrolling interests: $10.00 M.
Masco Corporation (MAS) FY2026 Q3 Revenue by Geography Sankey chart
Free to share unchanged, with credit to Plicit.ai · CC BY-NC-ND 4.0Download PNG

Intelligent Insights for Investors

Where in the world does Masco make its sales?

North America supplied 80% of sales this quarter, and International, in second place, supplied 20%. Where sales come from shapes how currency swings and local economies touch the company.

Is any part of Masco's sales by region shrinking while the total grows?

Yes. International fell 5.2% from a year earlier, while revenue as a whole grew 2.6%.

Intelligent Insights for Lenders

How much does Masco depend on the biggest piece of its sales by region?

Heavily: North America brought in 80% of sales this quarter, against 20% for International, the next largest. Lenders watch that concentration, since a slump in one market can reach most of the revenue.

Product waitlist

Health Check and Teardown for your own company

A health check uncovers insights of your private books, not a public ticker. Join this list to get notified as soon as we go-live!