
BEIGENE, LTD. (ONC) FY2025 Q1 P&L / Income Statement

Revenue by Product and Service by Geography

2025-01-01 to 2025-03-31

Swipe to see the full flow
BEIGENE, LTD. (ONC) FY2025 Q1 P&L / Income StatementIncome statement for 2025-01-01 through 2025-03-31. View: Product and Service by Geographical. Revenue uses this breakdown; costs and expenses retain the consolidated categories.SOURCESREVENUEGROSSOPERATINGPRE-TAXNETProduct revenue, net - UNITED STATESProduct revenue, net - CHINAProduct revenue, net - Europe - total revenueProduct revenue, net - Rest of world - total revenueCollaboration revenue - UNITED STATESCollaboration revenue - CHINACollaboration revenue - Europe - total revenueTotal revenuesGross profitCost of revenue (calculated)Cost of sales - productIncome (loss) from operationsOperating expenses (calculated)Research and developmentSelling, general and administrativeOther income (expense), net (calculated)Income (loss) before income taxesNet income (loss)Income tax expenseOther income (expense), net (calculated)Other income,net (calculated)$9.80 MIncome (loss) before income taxesIncome (loss)before income taxes$20.90 MIncome (loss) from operationsIncome (loss)from operations$11.10 MTotal revenuesTotal revenues$1.12 BGross profitGross profit$952.28 MNet income (loss)Net income (loss)$1.27 MOperating expenses (calculated)Operating expenses(calculated)$941.18 MProduct revenue, net - UNITED STATESProduct revenue, net - UNITED STATES$563.35 MIncome tax expenseIncome tax expense$19.63 MResearch and developmentResearch and development$481.89 MProduct revenue, net - CHINAProduct revenue, net - CHINA$396.36 MCost of revenue (calculated)Cost of revenue(calculated)$165.00 MSelling, general and administrativeSelling, general and administrative$459.29 MProduct revenue, net - Europe - total revenueProduct revenue, net -Europe - total revenue$116.90 MProduct revenue, net - Rest of world - total revenueProduct revenue, net - Restof world - total revenue$31.92 MCost of sales - productCost of sales - product$165.00 MCollaboration revenue - UNITED STATESCollaboration revenue- UNITED STATES$3.86 MCollaboration revenue - CHINACollaboration revenue - CHINA$3.23 MCollaboration revenue - Europe - total revenueCollaboration revenue- Europe - total revenue$1.66 M
Chart details

BEIGENE, LTD. (ONC) FY2025 Q1 P&L / Income Statement

Income statement for 2025-01-01 through 2025-03-31. View: Product and Service by Geographical. Revenue uses this breakdown; costs and expenses retain the consolidated categories.

Total revenues
1,117,279,000 US dollars
Cost of revenue (calculated)
165,002,000 US dollars
Gross profit
952,277,000 US dollars
Operating expenses (calculated)
941,175,000 US dollars
Income (loss) from operations
11,102,000 US dollars
Other income (expense), net (calculated)
9,798,000 US dollars
Income (loss) before income taxes
20,900,000 US dollars
Income tax expense
19,630,000 US dollars
Net income (loss)
1,270,000 US dollars
Collaboration revenue - Rest of world - total revenue
0 US dollars
Collaboration revenue - CHINA
3,230,000 US dollars
Collaboration revenue - UNITED STATES
3,863,000 US dollars
Collaboration revenue - Europe - total revenue
1,656,000 US dollars
Product revenue, net - Rest of world - total revenue
31,922,000 US dollars
Product revenue, net - CHINA
396,362,000 US dollars
Product revenue, net - UNITED STATES
563,348,000 US dollars
Product revenue, net - Europe - total revenue
116,898,000 US dollars
Cost of sales - product
165,002,000 US dollars
Selling, general and administrative
459,288,000 US dollars
Research and development
481,887,000 US dollars

Chart connections

  • Revenue less cost of revenue equals gross profit; gross profit less operating expenses equals operating income.
  • Operating income plus other income or expense equals income before tax. Income before tax less income tax expense or benefit equals net income.
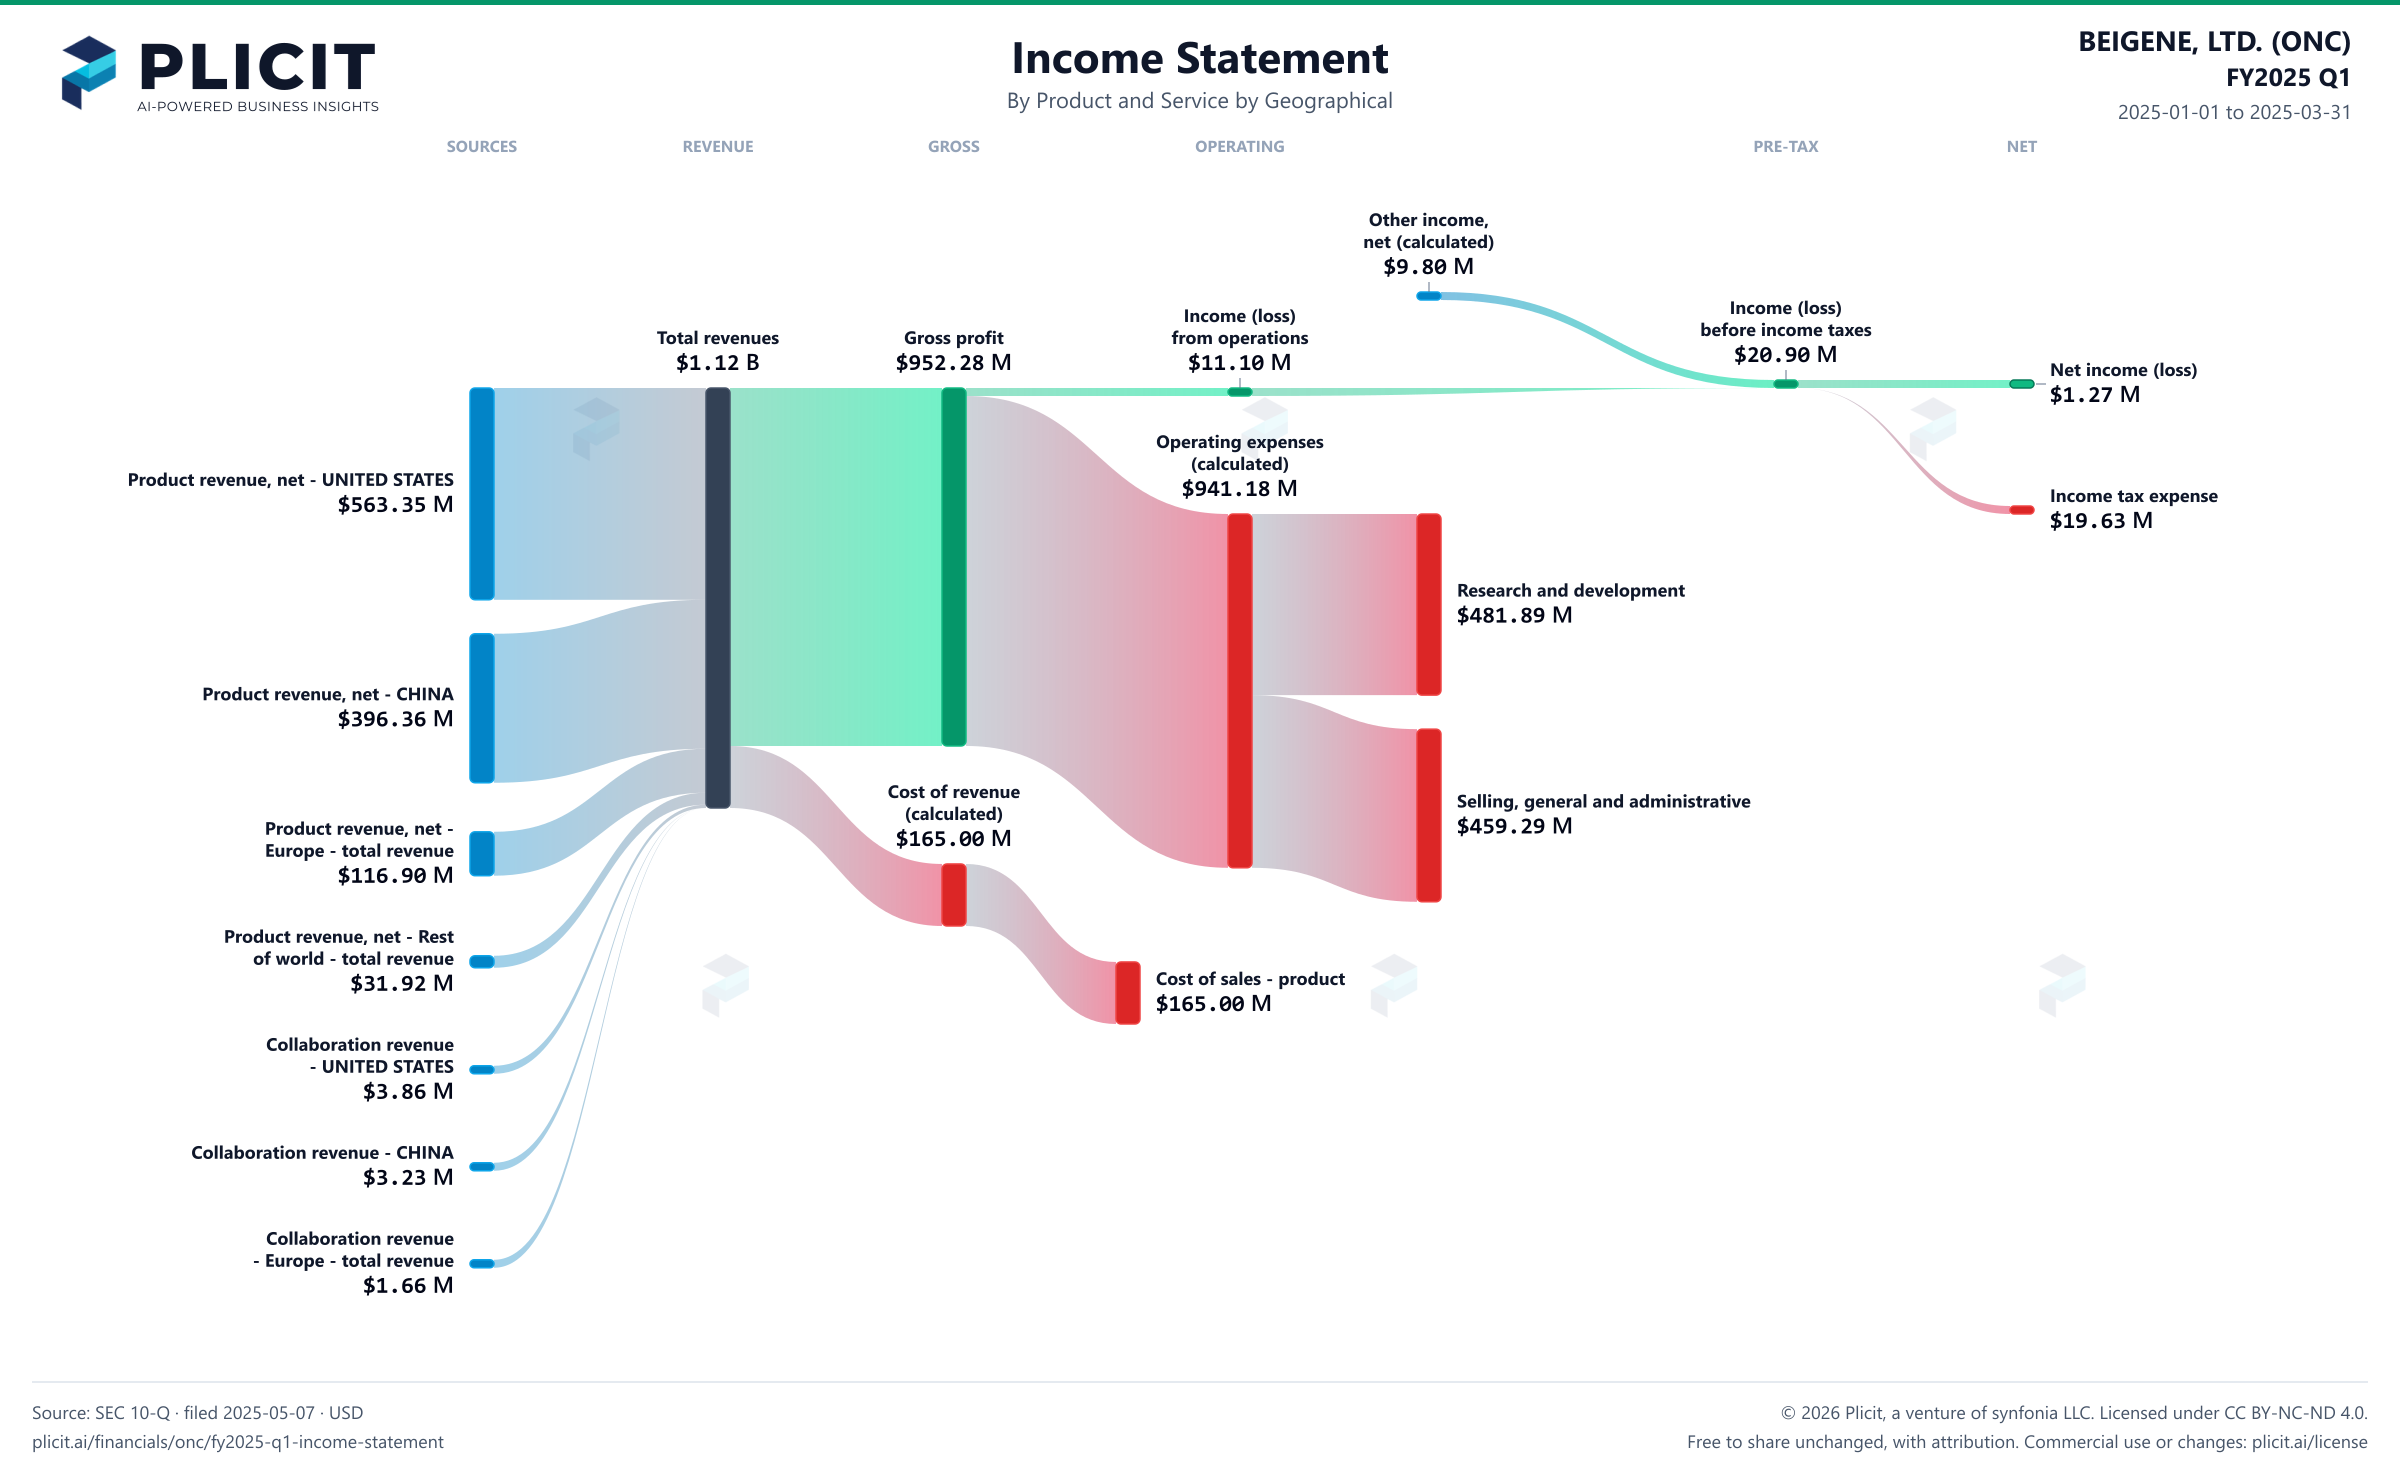
BEIGENE, LTD. (ONC) FY2025 Q1 P&L / Income Statement Sankey chart, Product and service — Product and Service by Geographical view
Free to share unchanged, with credit to Plicit.ai · CC BY-NC-ND 4.0Download PNG

Gross margin

85.2%

Gross profit / revenue

Operating margin

1.0%

Operating profit / revenue

Cash conversion

3471.0%

Operating cash / net income, same period

Newsletter

Get the teardowns by email

Subscribe if you want the public-company teardowns in your inbox when they're released.

Product waitlist

Health Check and Teardown for your own company

A health check uncovers insights of your private books, not a public ticker. Join this list to get notified as soon as we go-live!