
PROGRESSIVE CORP/OH/ (PGR) FY2024 Q3 Balance Sheet

Balance Sheet

As of 2024-09-30

Swipe to see the full flow
PROGRESSIVE CORP/OH/ (PGR) FY2024 Q3 Balance SheetBalance sheet as of 2024-09-30. The chart shows assets, liabilities and equity at that date.Liabilities$78.04 BAssets$105.20 BEquity$27.16 BGross equity(calculated)$27.31 BHOLDINGSASSETSCLAIM CLASSCLAIM SUB-CLASSCLAIMSFixed maturities (amortized cost: $74,595.2, $60,490.6, and $62,441.9)Premiums receivable, net of allowance for credit losses of $388.0, $361.2, and $369.1Reinsurance recoverablesCommon equities (cost: $733.5, $662.6, and $706.0)Deferred acquisition costsOther assetsShort-term investments (amortized cost: $756.5, $1,795.2, and $1,789.9)Nonredeemable preferred stocks (cost: $759.7, $976.9, and $977.1)Property and equipment, net of accumulated depreciation of $1,589.7, $1,596.9, and $1,655.1Net federal deferred income taxesAccrued investment incomePrepaid reinsurance premiumsCash and cash equivalentsRestricted cash and cash equivalentsLoss and loss adjustment expense reservesUnearned premiumsAccounts payable, accrued expenses, and other liabilitiesDebtRetained earningsPaid-in capitalCommon shares, $1.00 par value (authorized 900.0; issued 797.6, including treasury shares of 211.8, 212.6, and 212.3)AssetsLiabilitiesEquityGross equity (calculated)Net unrealized gains (losses) on fixed-maturity securitiesNet unrealized losses on forecasted transactionsForeign currency translation adjustmentFixed maturities (amortized cost: $74,595.2, $60,490.6, and $62,441.9)Fixed maturities$74.41 BLiabilitiesLiabilities$78.04 BLoss and loss adjustment expense reservesLoss and loss adjustment expense reserves$38.06 BAssetsAssets$105.20 BPremiums receivable, net of allowance for credit losses of $388.0, $361.2, and $369.1Premiums receivable, net$15.14 BReinsurance recoverablesReinsurance recoverables$4.88 BUnearned premiumsUnearned premiums$24.77 BCommon equities (cost: $733.5, $662.6, and $706.0)Common equities (cost: $733.5, $662.6, and $706.0)$3.50 BAccounts payable, accrued expenses, and other liabilitiesAccounts payable, accruedexpenses, and other liabilities$8.32 BDeferred acquisition costsDeferred acquisition costs$2.03 BOther assetsOther assets$1.54 BDebtDebt$6.89 BEquityEquity$27.16 BShort-term investments (amortized cost: $756.5, $1,795.2, and $1,789.9)Short-term investments$756.50 MGross equity (calculated)Gross equity(calculated)$27.31 BNonredeemable preferred stocks (cost: $759.7, $976.9, and $977.1)Nonredeemable preferred stocks$735.00 MRetained earningsRetained earnings$24.63 BProperty and equipment, net of accumulated depreciation of $1,589.7, $1,596.9, and $1,655.1Property and equipment, net$688.80 MPaid-in capitalPaid-in capital$2.10 BNet federal deferred income taxesNet federal deferred income taxes$598.00 MCommon shares, $1.00 par value (authorized 900.0; issued 797.6, including treasury shares of 211.8, 212.6, and 212.3)Common shares$585.80 MAccrued investment incomeAccrued investment income$560.30 MPrepaid reinsurance premiumsPrepaid reinsurance premiums$224.00 MNet unrealized gains (losses) on fixed-maturity securitiesNet unrealized gains (losses)on fixed-maturity securities−$139.70 MCash and cash equivalentsCash and cash equivalents$136.10 MNet unrealized losses on forecasted transactionsNet unrealized losses on forecasted transactions−$13.70 MRestricted cash and cash equivalentsRestricted cash and cash equivalents$10.90 MForeign currency translation adjustmentForeign currency translation adjustment−$1.00 M
Chart details

PROGRESSIVE CORP/OH/ (PGR) FY2024 Q3 Balance Sheet

Balance sheet as of 2024-09-30. The chart shows assets, liabilities and equity at that date.

Assets
105,202,500,000 US dollars
Liabilities
78,043,200,000 US dollars
Equity
27,159,300,000 US dollars
Fixed maturities (amortized cost: $74,595.2, $60,490.6, and $62,441.9)
74,411,200,000 US dollars
Premiums receivable, net of allowance for credit losses of $388.0, $361.2, and $369.1
15,135,400,000 US dollars
Reinsurance recoverables
4,881,500,000 US dollars
Common equities (cost: $733.5, $662.6, and $706.0)
3,497,000,000 US dollars
Deferred acquisition costs
2,031,600,000 US dollars
Other assets
1,536,200,000 US dollars
Short-term investments (amortized cost: $756.5, $1,795.2, and $1,789.9)
756,500,000 US dollars
Nonredeemable preferred stocks (cost: $759.7, $976.9, and $977.1)
735,000,000 US dollars
Property and equipment, net of accumulated depreciation of $1,589.7, $1,596.9, and $1,655.1
688,800,000 US dollars
Net federal deferred income taxes
598,000,000 US dollars
Accrued investment income
560,300,000 US dollars
Prepaid reinsurance premiums
224,000,000 US dollars
Cash and cash equivalents
136,100,000 US dollars
Restricted cash and cash equivalents
10,900,000 US dollars
Loss and loss adjustment expense reserves
38,061,500,000 US dollars
Unearned premiums
24,772,500,000 US dollars
Accounts payable, accrued expenses, and other liabilities
8,317,400,000 US dollars
Debt
6,891,800,000 US dollars
Retained earnings
24,631,700,000 US dollars
Paid-in capital
2,096,200,000 US dollars
Common shares, $1.00 par value (authorized 900.0; issued 797.6, including treasury shares of 211.8, 212.6, and 212.3)
585,800,000 US dollars
Serial Preferred Shares, Series B, no par value (cumulative, liquidation preference $1,000 per share) (authorized, issued, and outstanding of $0, $0.5, and $0.5)
0 US dollars
Net unrealized gains (losses) on fixed-maturity securities
negative 139,700,000 US dollars
Net unrealized losses on forecasted transactions
negative 13,700,000 US dollars
Foreign currency translation adjustment
negative 1,000,000 US dollars
Gross equity (calculated)
27,313,700,000 US dollars. Net equity plus the magnitudes of its negative contributions equals gross positive equity. The negative contributions enter this reconciliation as add-backs; their filed signs stay negative.

Chart connections

  • Assets equal liabilities plus consolidated equity. Consolidated equity includes noncontrolling interests when reported.
  • Treasury shares and other negative equity contributions reduce equity.
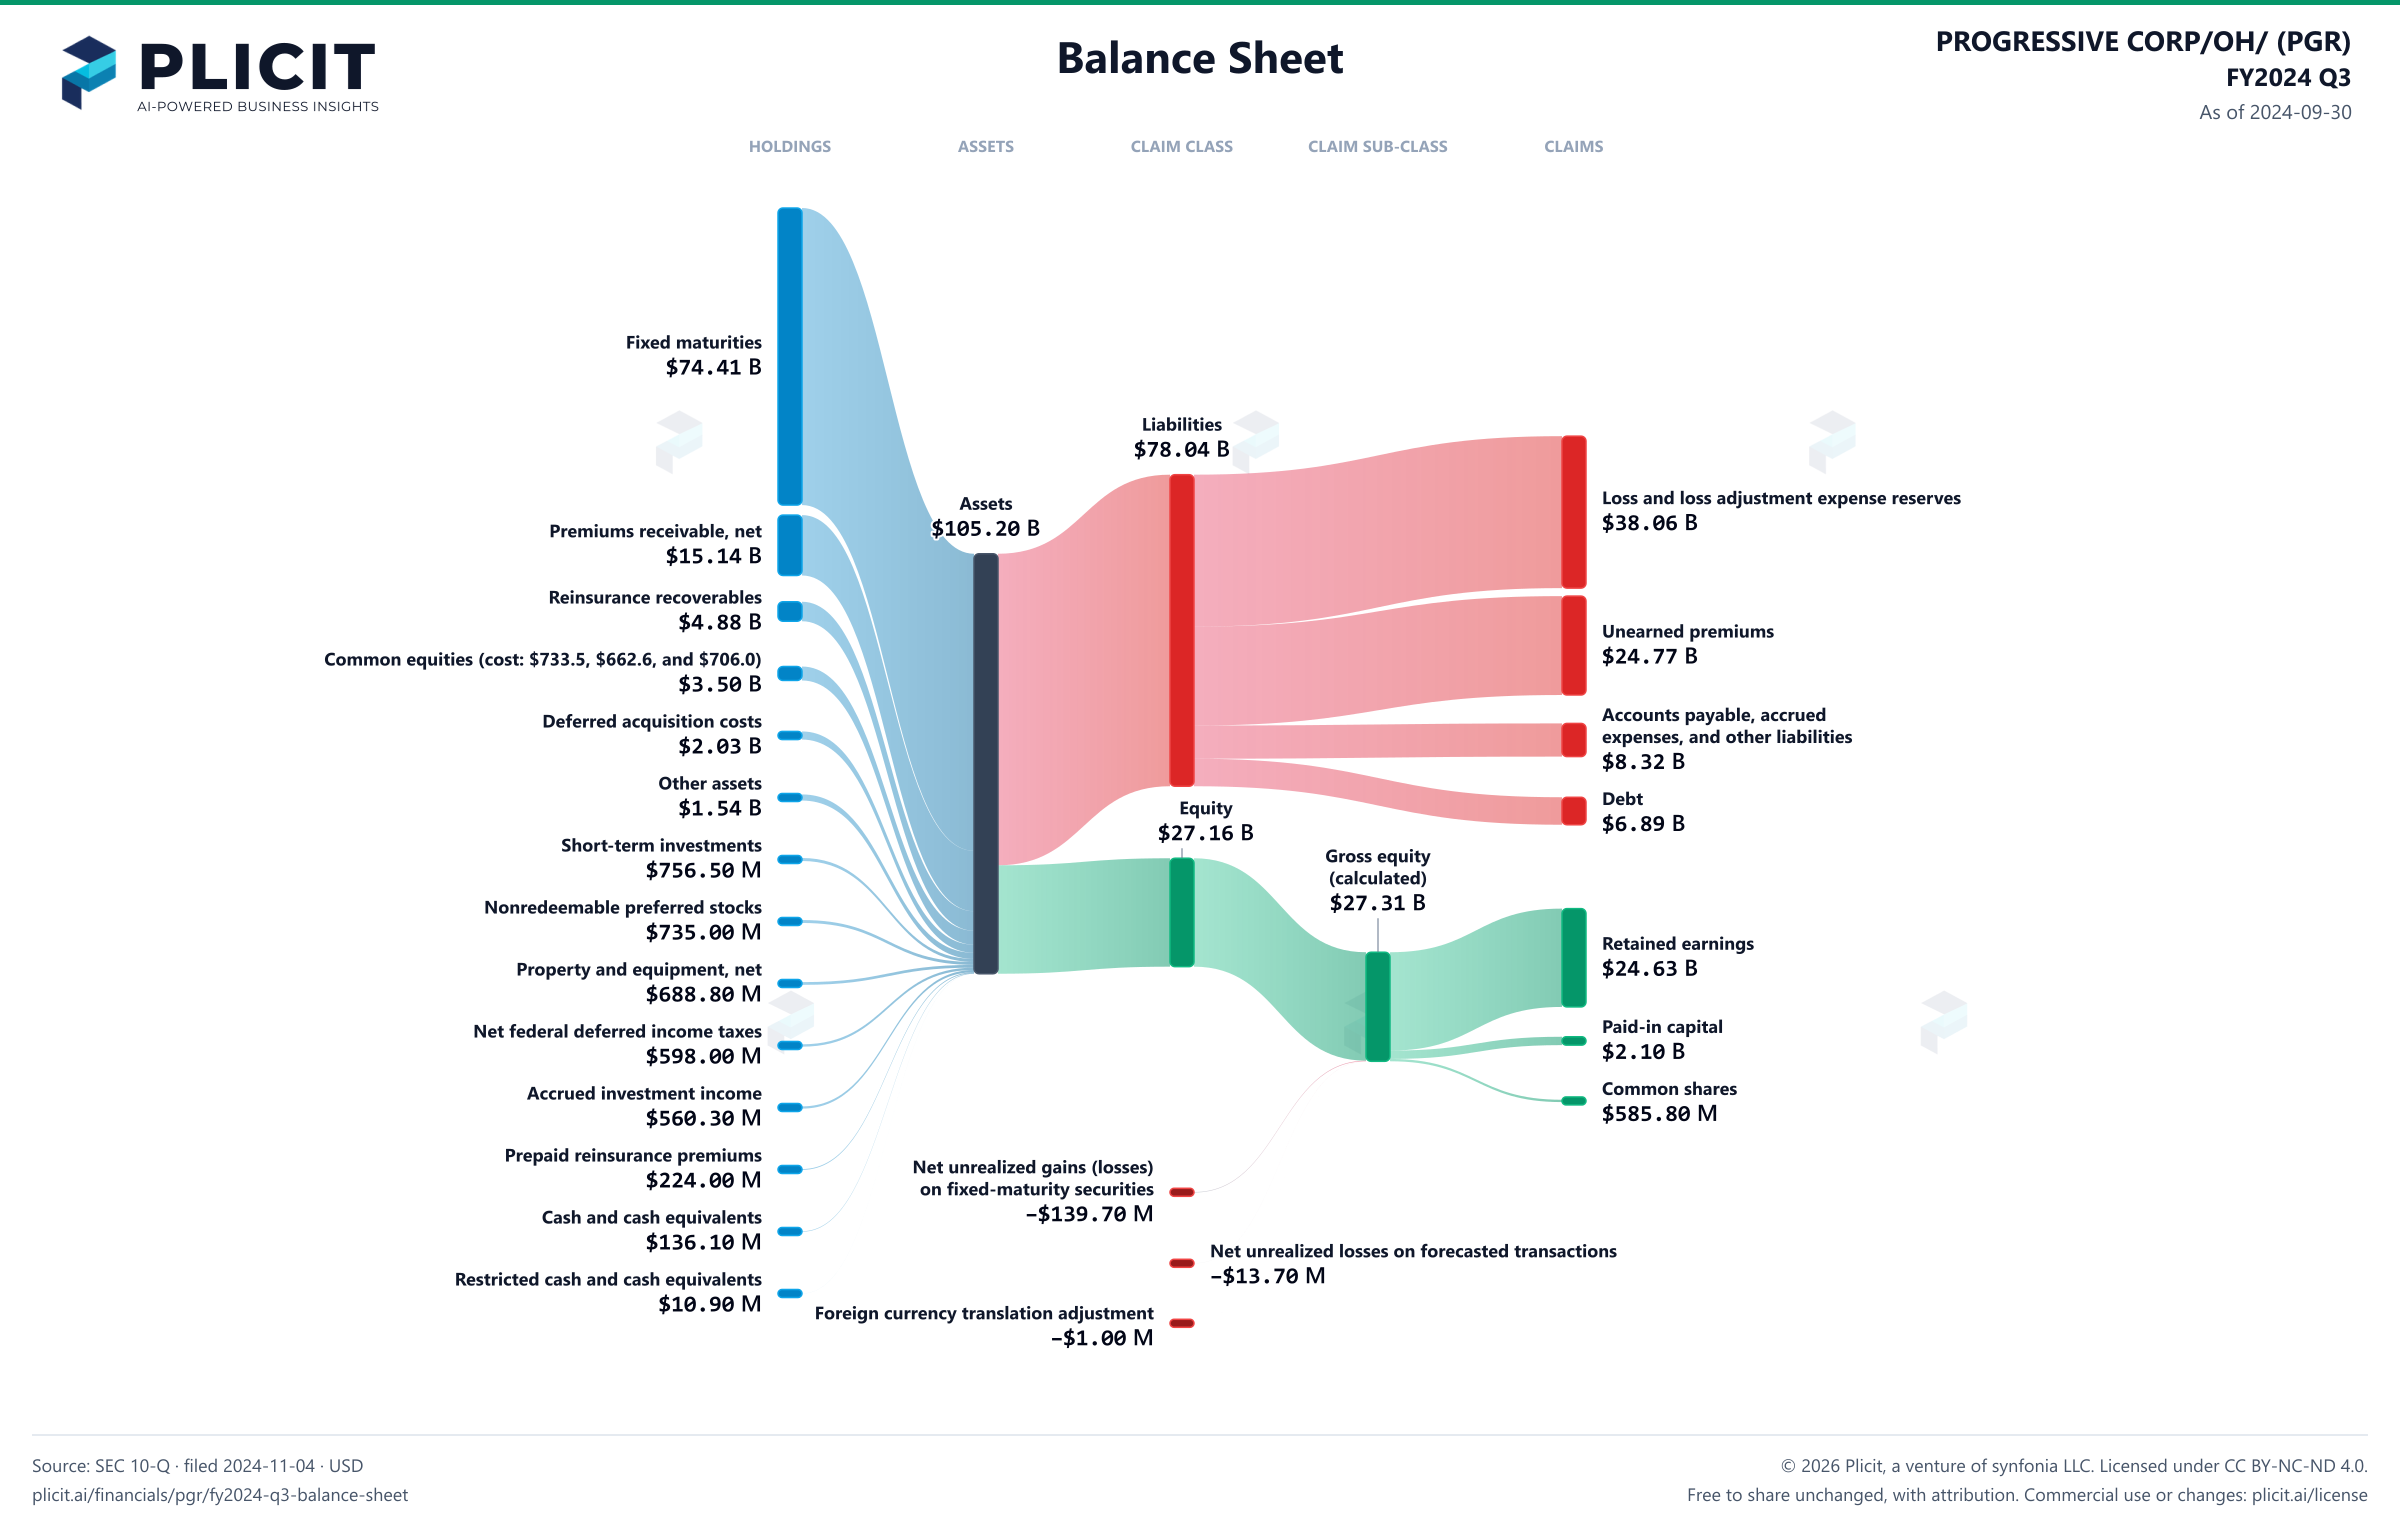
PROGRESSIVE CORP/OH/ (PGR) FY2024 Q3 Balance Sheet Sankey chart
Free to share unchanged, with credit to Plicit.ai · CC BY-NC-ND 4.0Download PNG

Newsletter

Get the teardowns by email

Subscribe if you want the public-company teardowns in your inbox when they're released.

Product waitlist

Health Check and Teardown for your own company

A health check uncovers insights of your private books, not a public ticker. Join this list to get notified as soon as we go-live!