
XCEL ENERGY INC (XEL) FY2024 Annual Balance Sheet

Balance Sheet

As of 2024-12-31

Swipe to see the full flow
XCEL ENERGY INC (XEL) FY2024 Annual Balance SheetBalance sheet as of 2024-12-31. The chart shows assets, liabilities and equity at that date.Current liabilities$6.46 BCurrent assets$4.33 BLiabilities(calculated)$50.51 BAssets$70.04 BNon-current assets$65.71 BNon-current liabilities$44.05 BEquity$19.52 BGross equity(calculated)$19.59 BHOLDINGSASSET CLASSASSETSCLAIM CLASSCLAIM SUB-CLASSCLAIMSAccounts receivable, netAccrued unbilled revenuesInventoriesPrepayments and otherRegulatory assetsCash and cash equivalentsDerivative instrumentsPrepaid taxesProperty, plant and equipment, netNuclear decommissioning fund and other investmentsRegulatory assetsOperating lease right-of-use assetsOtherDerivative instrumentsAccounts payableCurrent portion of long-term debtRegulatory liabilitiesShort-term debtOtherTaxes accruedDividends payableAccrued interestOperating Lease, Liability, CurrentDerivative instrumentsLong-term debtRegulatory liabilitiesDeferred income taxesAsset retirement obligationsOperating lease liabilitiesPension and employee benefit obligationsCustomer advancesOtherDerivative instrumentsDeferred investment tax creditsAdditional paid in capitalRetained earningsCommon stock — 1,000,000,000 shares authorized of $2.50 par value; 574,365,598 and 554,941,703 shares outstanding at Dec. 31, 2024 and Dec. 31, 2023, respectivelyCurrent assetsNon-current assetsAssetsCurrent liabilitiesNon-current liabilitiesLiabilities (calculated)EquityGross equity (calculated)Accumulated other comprehensive lossAccounts payableAccounts payable$1.78 BCurrent portion of long-term debtCurrent portion of long-term debt$1.10 BRegulatory liabilitiesRegulatory liabilities$852.00 MShort-term debtShort-term debt$695.00 MAccounts receivable, netAccounts receivable, net$1.25 BCurrent liabilitiesCurrent liabilities$6.46 BOtherOther$635.00 MAccrued unbilled revenuesAccrued unbilled revenues$832.00 MTaxes accruedTaxes accrued$535.00 MInventoriesInventories$666.00 MCurrent assetsCurrent assets$4.33 BDividends payableDividends payable$314.00 MPrepayments and otherPrepayments and other$652.00 MAccrued interestAccrued interest$280.00 MRegulatory assetsRegulatory assets$561.00 MLiabilities (calculated)Liabilities(calculated)$50.51 BOperating Lease, Liability, CurrentOperating Lease, Liability, Current$227.00 MAssetsAssets$70.04 BCash and cash equivalentsCash and cash equivalents$179.00 MDerivative instrumentsDerivative instruments$37.00 MDerivative instrumentsDerivative instruments$114.00 MPrepaid taxesPrepaid taxes$72.00 MLong-term debtLong-term debt$27.32 BNon-current assetsNon-current assets$65.71 BNon-current liabilitiesNon-current liabilities$44.05 BRegulatory liabilitiesRegulatory liabilities$6.01 BProperty, plant and equipment, netProperty, plant and equipment, net$57.20 BDeferred income taxesDeferred income taxes$5.32 BEquityEquity$19.52 BAsset retirement obligationsAsset retirement obligations$3.71 BOperating lease liabilitiesOperating lease liabilities$867.00 MPension and employee benefit obligationsPension and employee benefit obligations$477.00 MNuclear decommissioning fund and other investmentsNuclear decommissioning fund and other investments$3.90 BCustomer advancesCustomer advances$146.00 MRegulatory assetsRegulatory assets$2.85 BOtherOther$89.00 MOperating lease right-of-use assetsOperating lease right-of-use assets$1.06 BDerivative instrumentsDerivative instruments$77.00 MOtherOther$635.00 MDeferred investment tax creditsDeferred investment tax credits$40.00 MGross equity (calculated)Gross equity(calculated)$19.59 BDerivative instrumentsDerivative instruments$72.00 MAdditional paid in capitalAdditional paid in capital$9.60 BRetained earningsRetained earnings$8.55 BCommon stock — 1,000,000,000 shares authorized of $2.50 par value; 574,365,598 and 554,941,703 shares outstanding at Dec. 31, 2024 and Dec. 31, 2023, respectivelyCommon stock$1.44 BAccumulated other comprehensive lossAccumulated other comprehensive loss−$68.00 M
Chart details

XCEL ENERGY INC (XEL) FY2024 Annual Balance Sheet

Balance sheet as of 2024-12-31. The chart shows assets, liabilities and equity at that date.

Assets
70,035,000,000 US dollars
Current assets
4,325,000,000 US dollars
Non-current assets
65,710,000,000 US dollars
Liabilities (calculated)
50,513,000,000 US dollars
Current liabilities
6,459,000,000 US dollars
Non-current liabilities
44,054,000,000 US dollars
Equity
19,522,000,000 US dollars
Accounts receivable, net
1,249,000,000 US dollars
Accrued unbilled revenues
832,000,000 US dollars
Inventories
666,000,000 US dollars
Prepayments and other
652,000,000 US dollars
Regulatory assets
561,000,000 US dollars
Cash and cash equivalents
179,000,000 US dollars
Derivative instruments
114,000,000 US dollars
Prepaid taxes
72,000,000 US dollars
Property, plant and equipment, net
57,198,000,000 US dollars
Nuclear decommissioning fund and other investments
3,896,000,000 US dollars
Regulatory assets
2,849,000,000 US dollars
Operating lease right-of-use assets
1,060,000,000 US dollars
Other
635,000,000 US dollars
Derivative instruments
72,000,000 US dollars
Accounts payable
1,781,000,000 US dollars
Current portion of long-term debt
1,103,000,000 US dollars
Regulatory liabilities
852,000,000 US dollars
Short-term debt
695,000,000 US dollars
Other
635,000,000 US dollars
Taxes accrued
535,000,000 US dollars
Dividends payable
314,000,000 US dollars
Accrued interest
280,000,000 US dollars
Operating Lease, Liability, Current
227,000,000 US dollars
Derivative instruments
37,000,000 US dollars
Long-term debt
27,316,000,000 US dollars
Regulatory liabilities
6,010,000,000 US dollars
Deferred income taxes
5,319,000,000 US dollars
Asset retirement obligations
3,713,000,000 US dollars
Operating lease liabilities
867,000,000 US dollars
Pension and employee benefit obligations
477,000,000 US dollars
Customer advances
146,000,000 US dollars
Other
89,000,000 US dollars
Derivative instruments
77,000,000 US dollars
Deferred investment tax credits
40,000,000 US dollars
Additional paid in capital
9,601,000,000 US dollars
Retained earnings
8,553,000,000 US dollars
Common stock — 1,000,000,000 shares authorized of $2.50 par value; 574,365,598 and 554,941,703 shares outstanding at Dec. 31, 2024 and Dec. 31, 2023, respectively
1,436,000,000 US dollars
Accumulated other comprehensive loss
negative 68,000,000 US dollars
Gross equity (calculated)
19,590,000,000 US dollars. Net equity plus the magnitudes of its negative contributions equals gross positive equity. The negative contributions enter this reconciliation as add-backs; their filed signs stay negative.

Chart connections

  • Assets equal liabilities plus consolidated equity. Consolidated equity includes noncontrolling interests when reported.
  • Treasury shares and other negative equity contributions reduce equity.
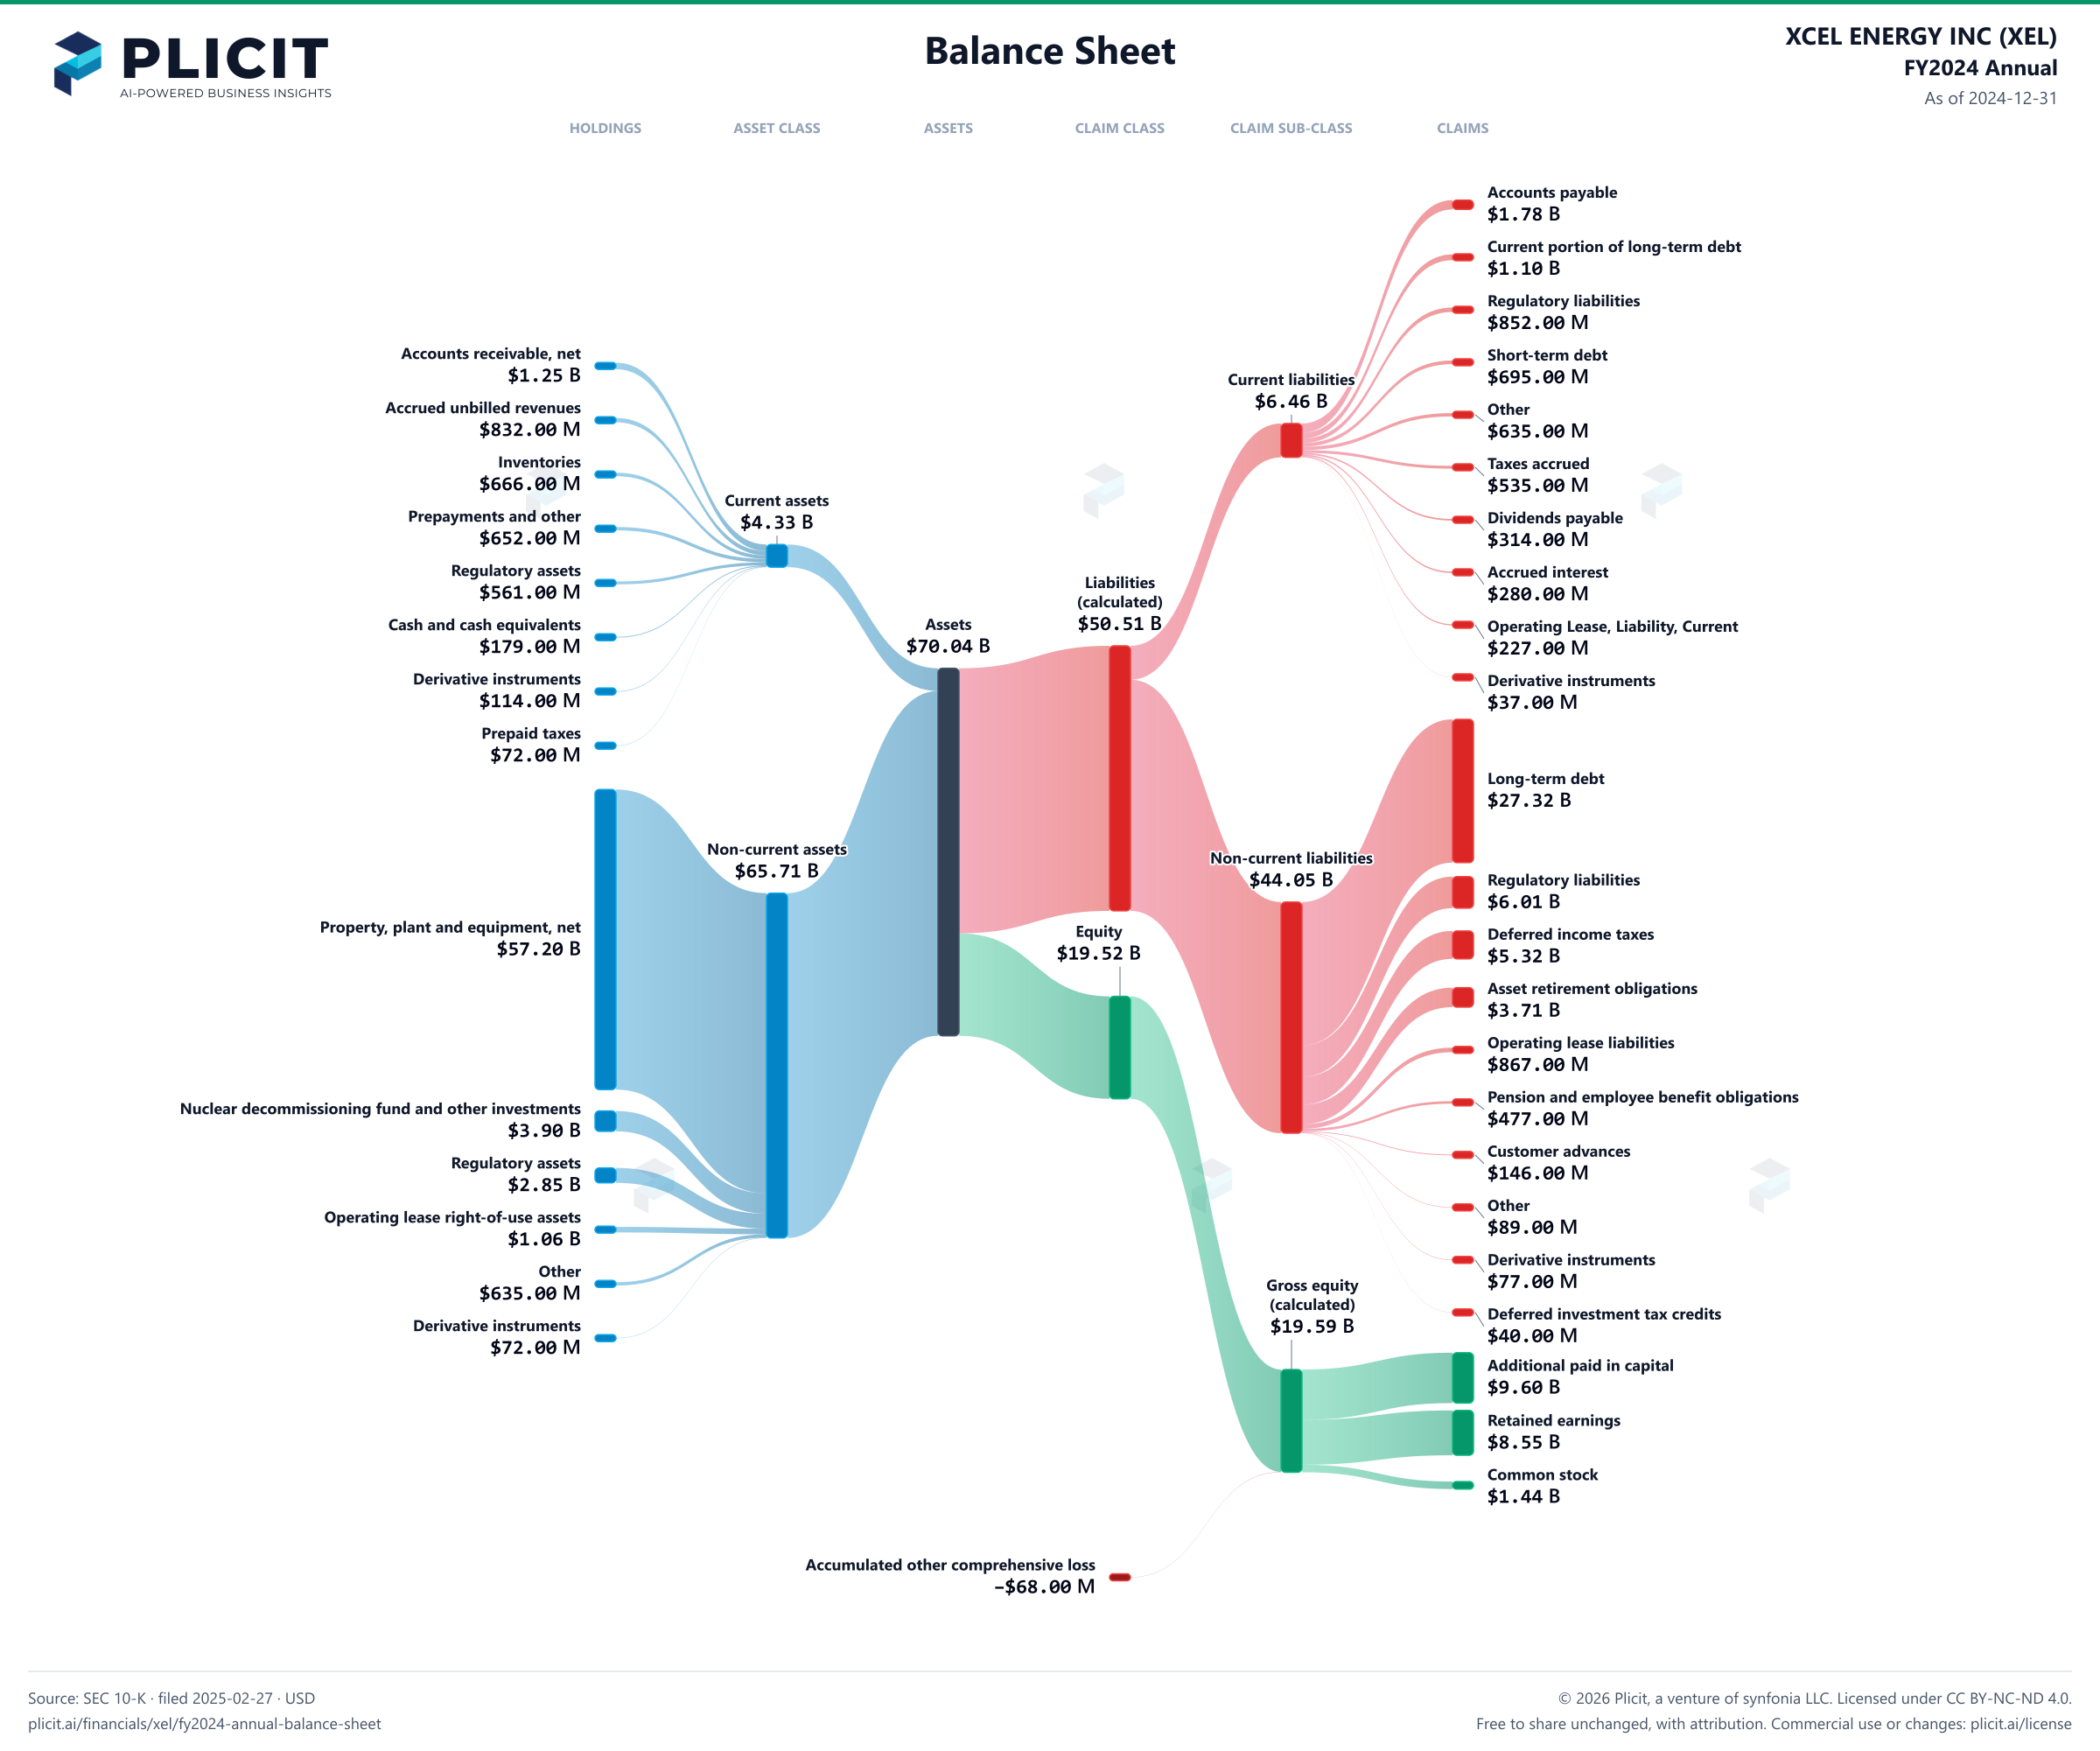
XCEL ENERGY INC (XEL) FY2024 Annual Balance Sheet Sankey chart
Free to share unchanged, with credit to Plicit.ai · CC BY-NC-ND 4.0Download PNG

Newsletter

Get the teardowns by email

Subscribe if you want the public-company teardowns in your inbox when they're released.

Product waitlist

Health Check and Teardown for your own company

A health check uncovers insights of your private books, not a public ticker. Join this list to get notified as soon as we go-live!