
XPO, Inc. (XPO) FY2026 Q3 P&L / Income Statement

Published · Updated Source: Form 10-Q on SEC EDGAR filed (opens in a new tab)

Key Takeaways

  • Operating income rose 76% to $288.00 M, while net income more than doubled to $181.00 M.
  • Tax took a smaller bite: the filing puts the rate at 24.8%, against 26.9% a year earlier.
  • Interest fell to $50.00 M, and operating profit covered it 5.8 times, up from 3.0.
  • North American LTL grew 17% to $1.47 B, against 5% for European Transportation.
  • Costs and expenses took $87.86 of every $100 of sales, leaving $7.63 as profit.

The Unvarnished Truth

XPO's operating profit jumped 76%, and net income more than doubled

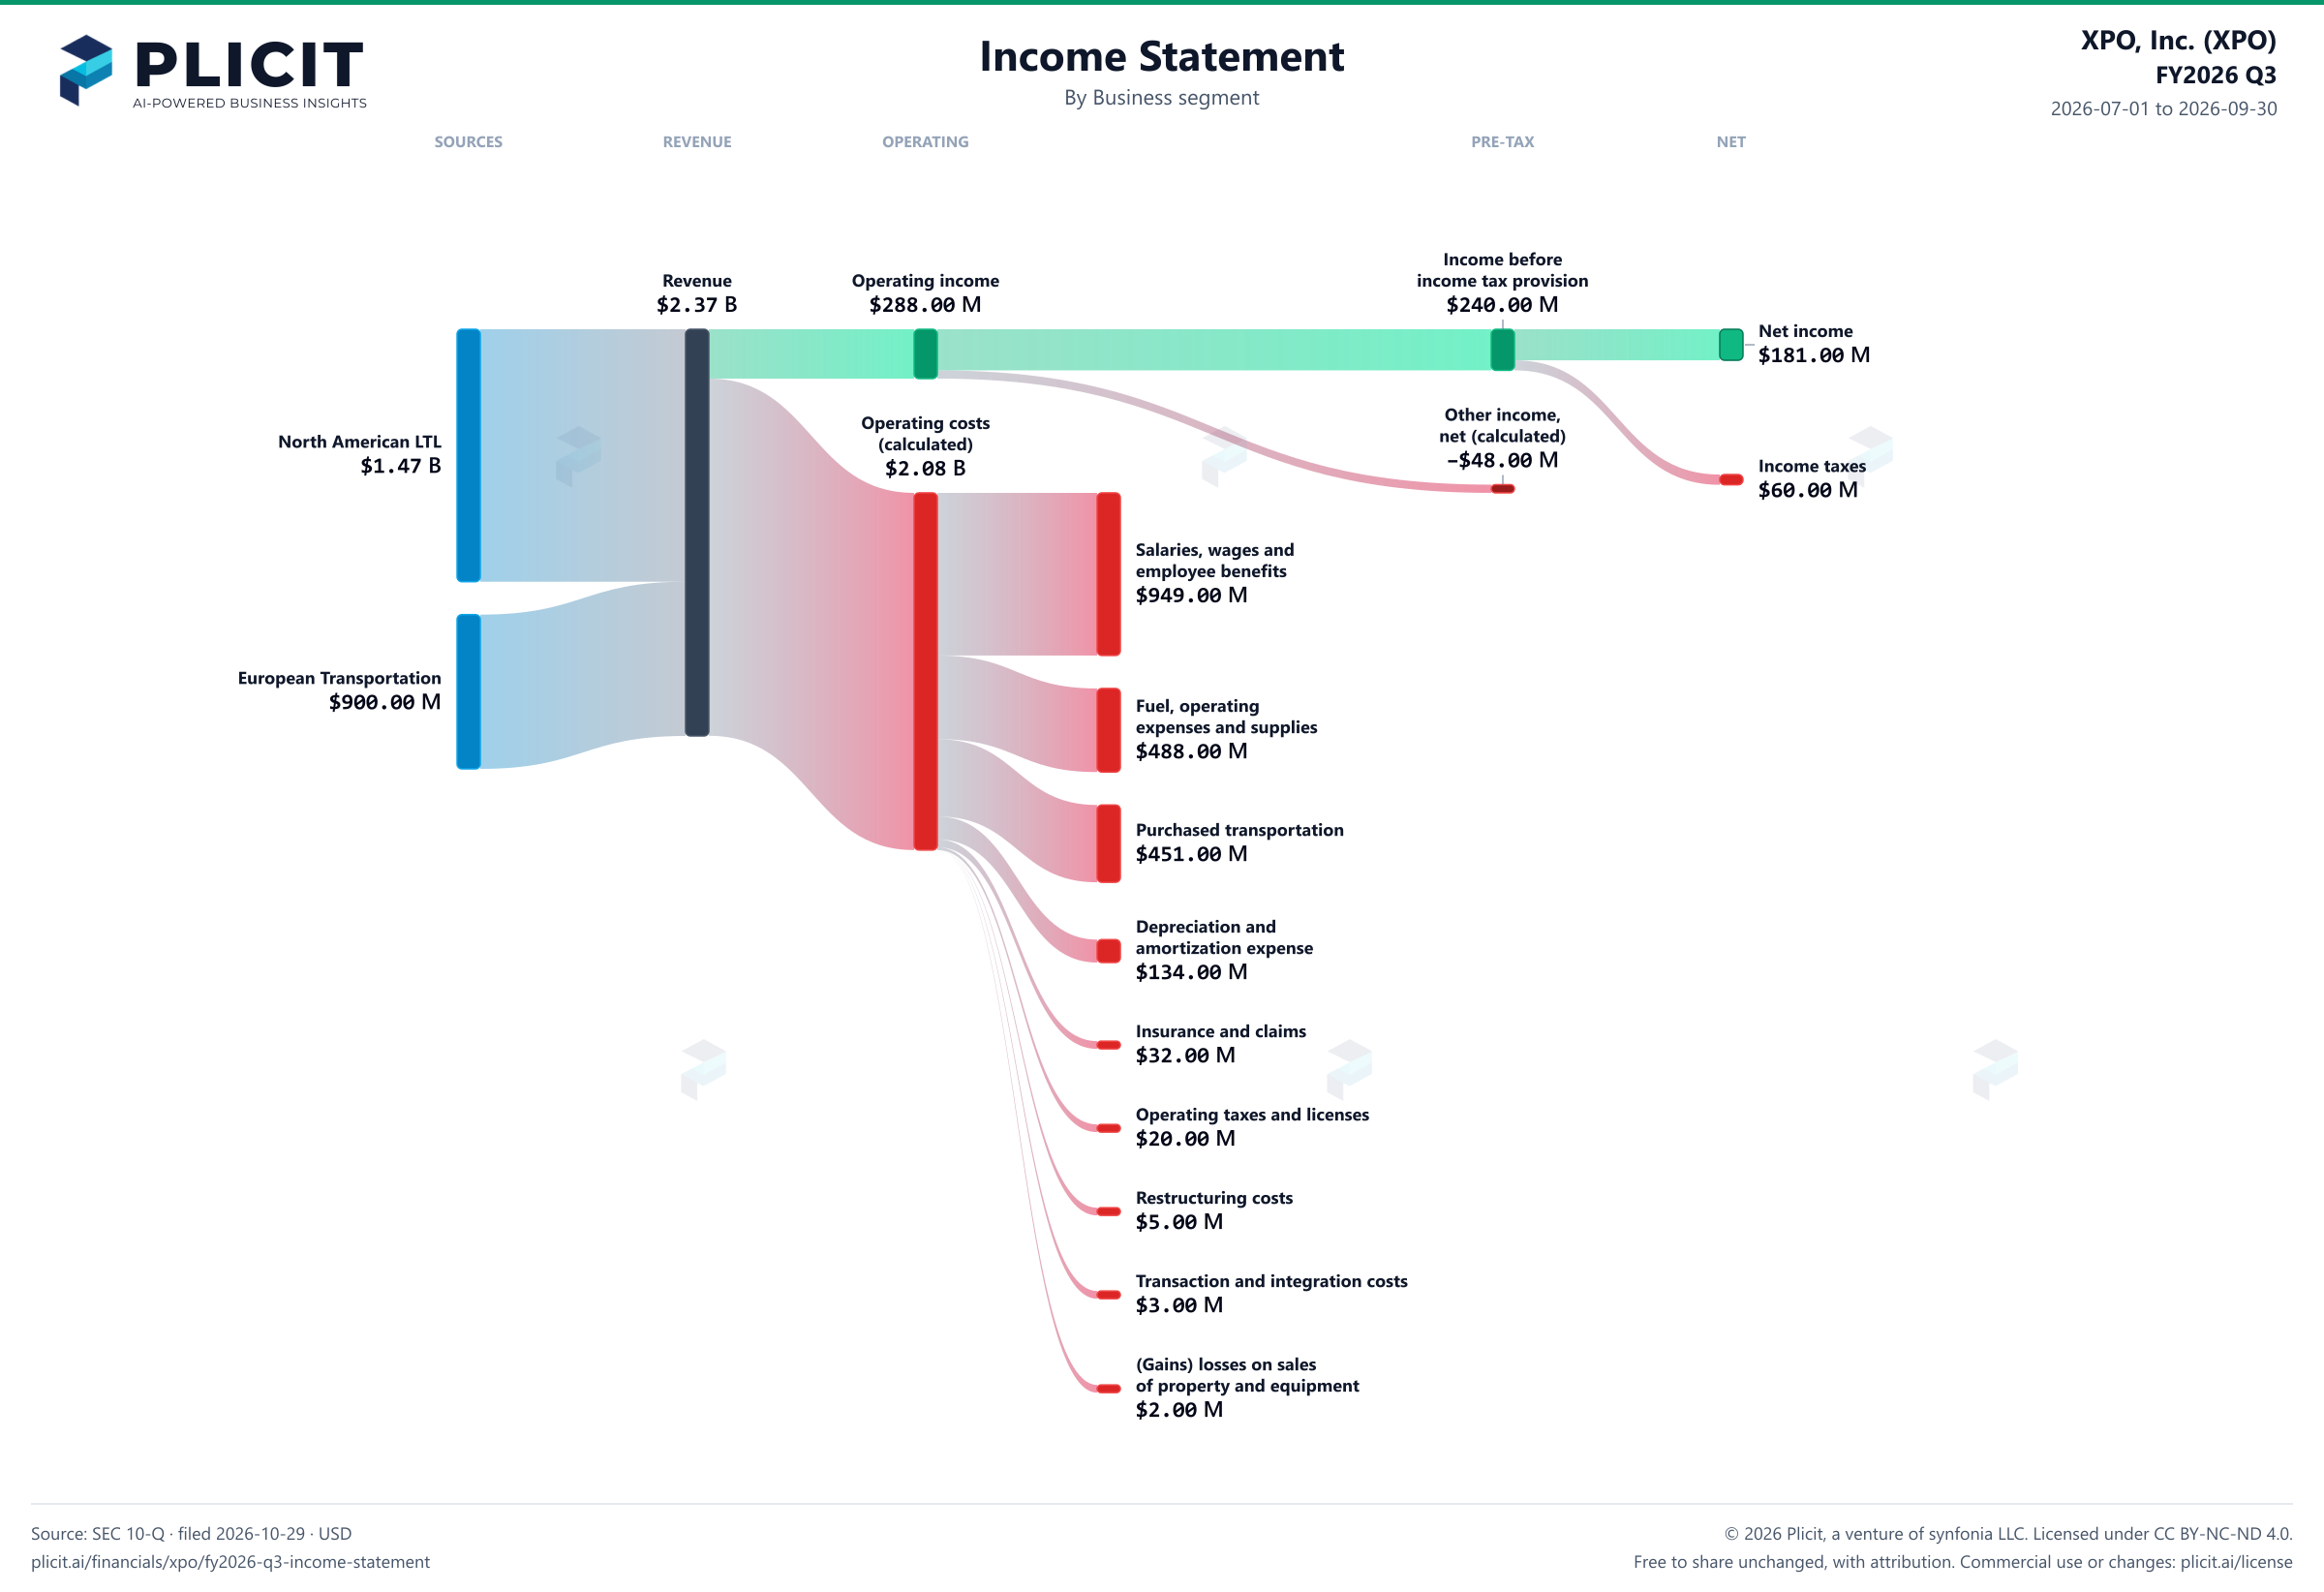
XPO's operating profit jumped 76% to $288.00 M, and net income more than doubled. The engine is North American LTL, which brought in $1.47 B and grew 17%. European Transportation grew 5%. Costs and expenses took $87.86 of every $100 of sales, which left $7.63 of profit. The question is how much of that jump came from the core business rather than from a lower tax bill or lighter interest. The filing says its effective tax rate was 24.8%, against 26.9% a year earlier.

Part of the jump is a year-ago charge. The filing says a $35.00 M environmental charge hit the prior-year quarter, and without it the rise would be 45%, not 76%. Interest fell to $50.00 M, the filing says, because of debt repayment and lower rates on variable-rate debt. Restructuring costs of $5.00 M were primarily in European Transportation, a segment that grew 5%. Interest took 17% of operating profit, against 33% a year earlier. Costs rose more slowly than sales, so the gap between them widened.

For a reader, the income statement says XPO is earning more per dollar of sales, though only modestly. Profit is $7.63 per $100 of sales, and the filing does not say how much of the margin gain will last. Lower interest and a smaller tax bill may repeat, while the prior-year charge does not. What would settle it: will operating profit keep rising once the prior-year charge is out of the comparison, or does the growth hold up next quarter?
2026-07-01 to 2026-09-30

Revenue by Business Segment

Swipe to see the full flow
XPO, Inc. (XPO) FY2026 Q3 P&L / Income StatementIncome statement for 2026-07-01 through 2026-09-30. View: Business segment. Revenue uses this breakdown; costs and expenses retain the consolidated categories.SOURCESREVENUEOPERATINGPRE-TAXNETNorth American LTLEuropean TransportationRevenueOperating incomeOperating costs, including other operating expenses (calculated)Salaries, wages and employee benefitsFuel, operating expenses and suppliesPurchased transportationDepreciation and amortization expenseInsurance and claimsOperating taxes and licensesRestructuring costsTransaction and integration costs(Gains) losses on sales of property and equipmentIncome before income tax provisionOther income (expense), net (calculated)Net incomeIncome tax provisionIncome before income tax provisionIncome beforeincome tax provision$240.00 MRevenueRevenue$2.37 BOperating incomeOperating income$288.00 MNet incomeNet income$181.00 MOperating costs, including other operating expenses (calculated)Operating costs(calculated)$2.08 BNorth American LTLNorth American LTL$1.47 BIncome tax provisionIncome taxes$60.00 MOther income (expense), net (calculated)Other income,net (calculated)−$48.00 MSalaries, wages and employee benefitsSalaries, wages andemployee benefits$949.00 MEuropean TransportationEuropean Transportation$900.00 MFuel, operating expenses and suppliesFuel, operatingexpenses and supplies$488.00 MPurchased transportationPurchased transportation$451.00 MDepreciation and amortization expenseDepreciation andamortization expense$134.00 MInsurance and claimsInsurance and claims$32.00 MOperating taxes and licensesOperating taxes and licenses$20.00 MRestructuring costsRestructuring costs$5.00 MTransaction and integration costsTransaction and integration costs$3.00 M(Gains) losses on sales of property and equipment(Gains) losses on salesof property and equipment$2.00 M
Chart details

XPO, Inc. (XPO) FY2026 Q3 P&L / Income Statement

Income statement for 2026-07-01 through 2026-09-30. View: Business segment. Revenue uses this breakdown; costs and expenses retain the consolidated categories.

Revenue
2,373,000,000 US dollars
Operating costs, including other operating expenses (calculated)
2,084,000,000 US dollars
Operating income
288,000,000 US dollars
Other income (expense), net (calculated)
negative 48,000,000 US dollars
Income before income tax provision
240,000,000 US dollars
Income tax provision
60,000,000 US dollars
Net income
181,000,000 US dollars
North American LTL
1,473,000,000 US dollars
European Transportation
900,000,000 US dollars
Fuel, operating expenses and supplies
488,000,000 US dollars
Insurance and claims
32,000,000 US dollars
Operating taxes and licenses
20,000,000 US dollars
Purchased transportation
451,000,000 US dollars
Restructuring costs
5,000,000 US dollars
Salaries, wages and employee benefits
949,000,000 US dollars
Transaction and integration costs
3,000,000 US dollars
(Gains) losses on sales of property and equipment
2,000,000 US dollars
Depreciation and amortization expense
134,000,000 US dollars
Legal matters
0 US dollars
Pre-Con-way acquisition environmental matter
0 US dollars

Chart connections

  • Revenue minus operating expenses equals operating income.
  • Operating income plus other income or expense equals income before tax. Income before tax less income tax expense or benefit equals net income.
  • The amounts that make up operating profit come to $289.00 M and operating profit is $288.00 M; the $1.00 M difference is within the rounding of the filed amounts.
  • The amounts that make up net income come to $180.00 M and net income is $181.00 M; the $1.00 M difference is within the rounding of the filed amounts.
XPO, Inc. (XPO) FY2026 Q3 P&L / Income Statement Sankey chart, Business segment view
Free to share unchanged, with credit to Plicit.ai · CC BY-NC-ND 4.0Download PNG

Intelligent Insights for Investors

Did XPO make a profit this period?

Yes: it made $181.00 M of profit (what's left after every cost, interest charge and tax) this quarter, or $7.63 of every $100 of sales.

Intelligent Insights for Lenders

Does XPO earn enough to cover its interest payments?

Yes: its operating profit covered its interest 5.8 times this quarter, against 3.0 times a year earlier.

Intelligent Insights for Everyone

How does XPO make its money?

Mostly from North American LTL: 62% of its $2.37 B of revenue this quarter, ahead of European Transportation at 38%.

Product waitlist

Health Check and Teardown for your own company

A health check uncovers insights of your private books, not a public ticker. Join this list to get notified as soon as we go-live!