
XPO, Inc. (XPO) FY2026 Q3 P&L / Income Statement

Published · Updated Source: Form 10-Q on SEC EDGAR filed (opens in a new tab)

Key Takeaways

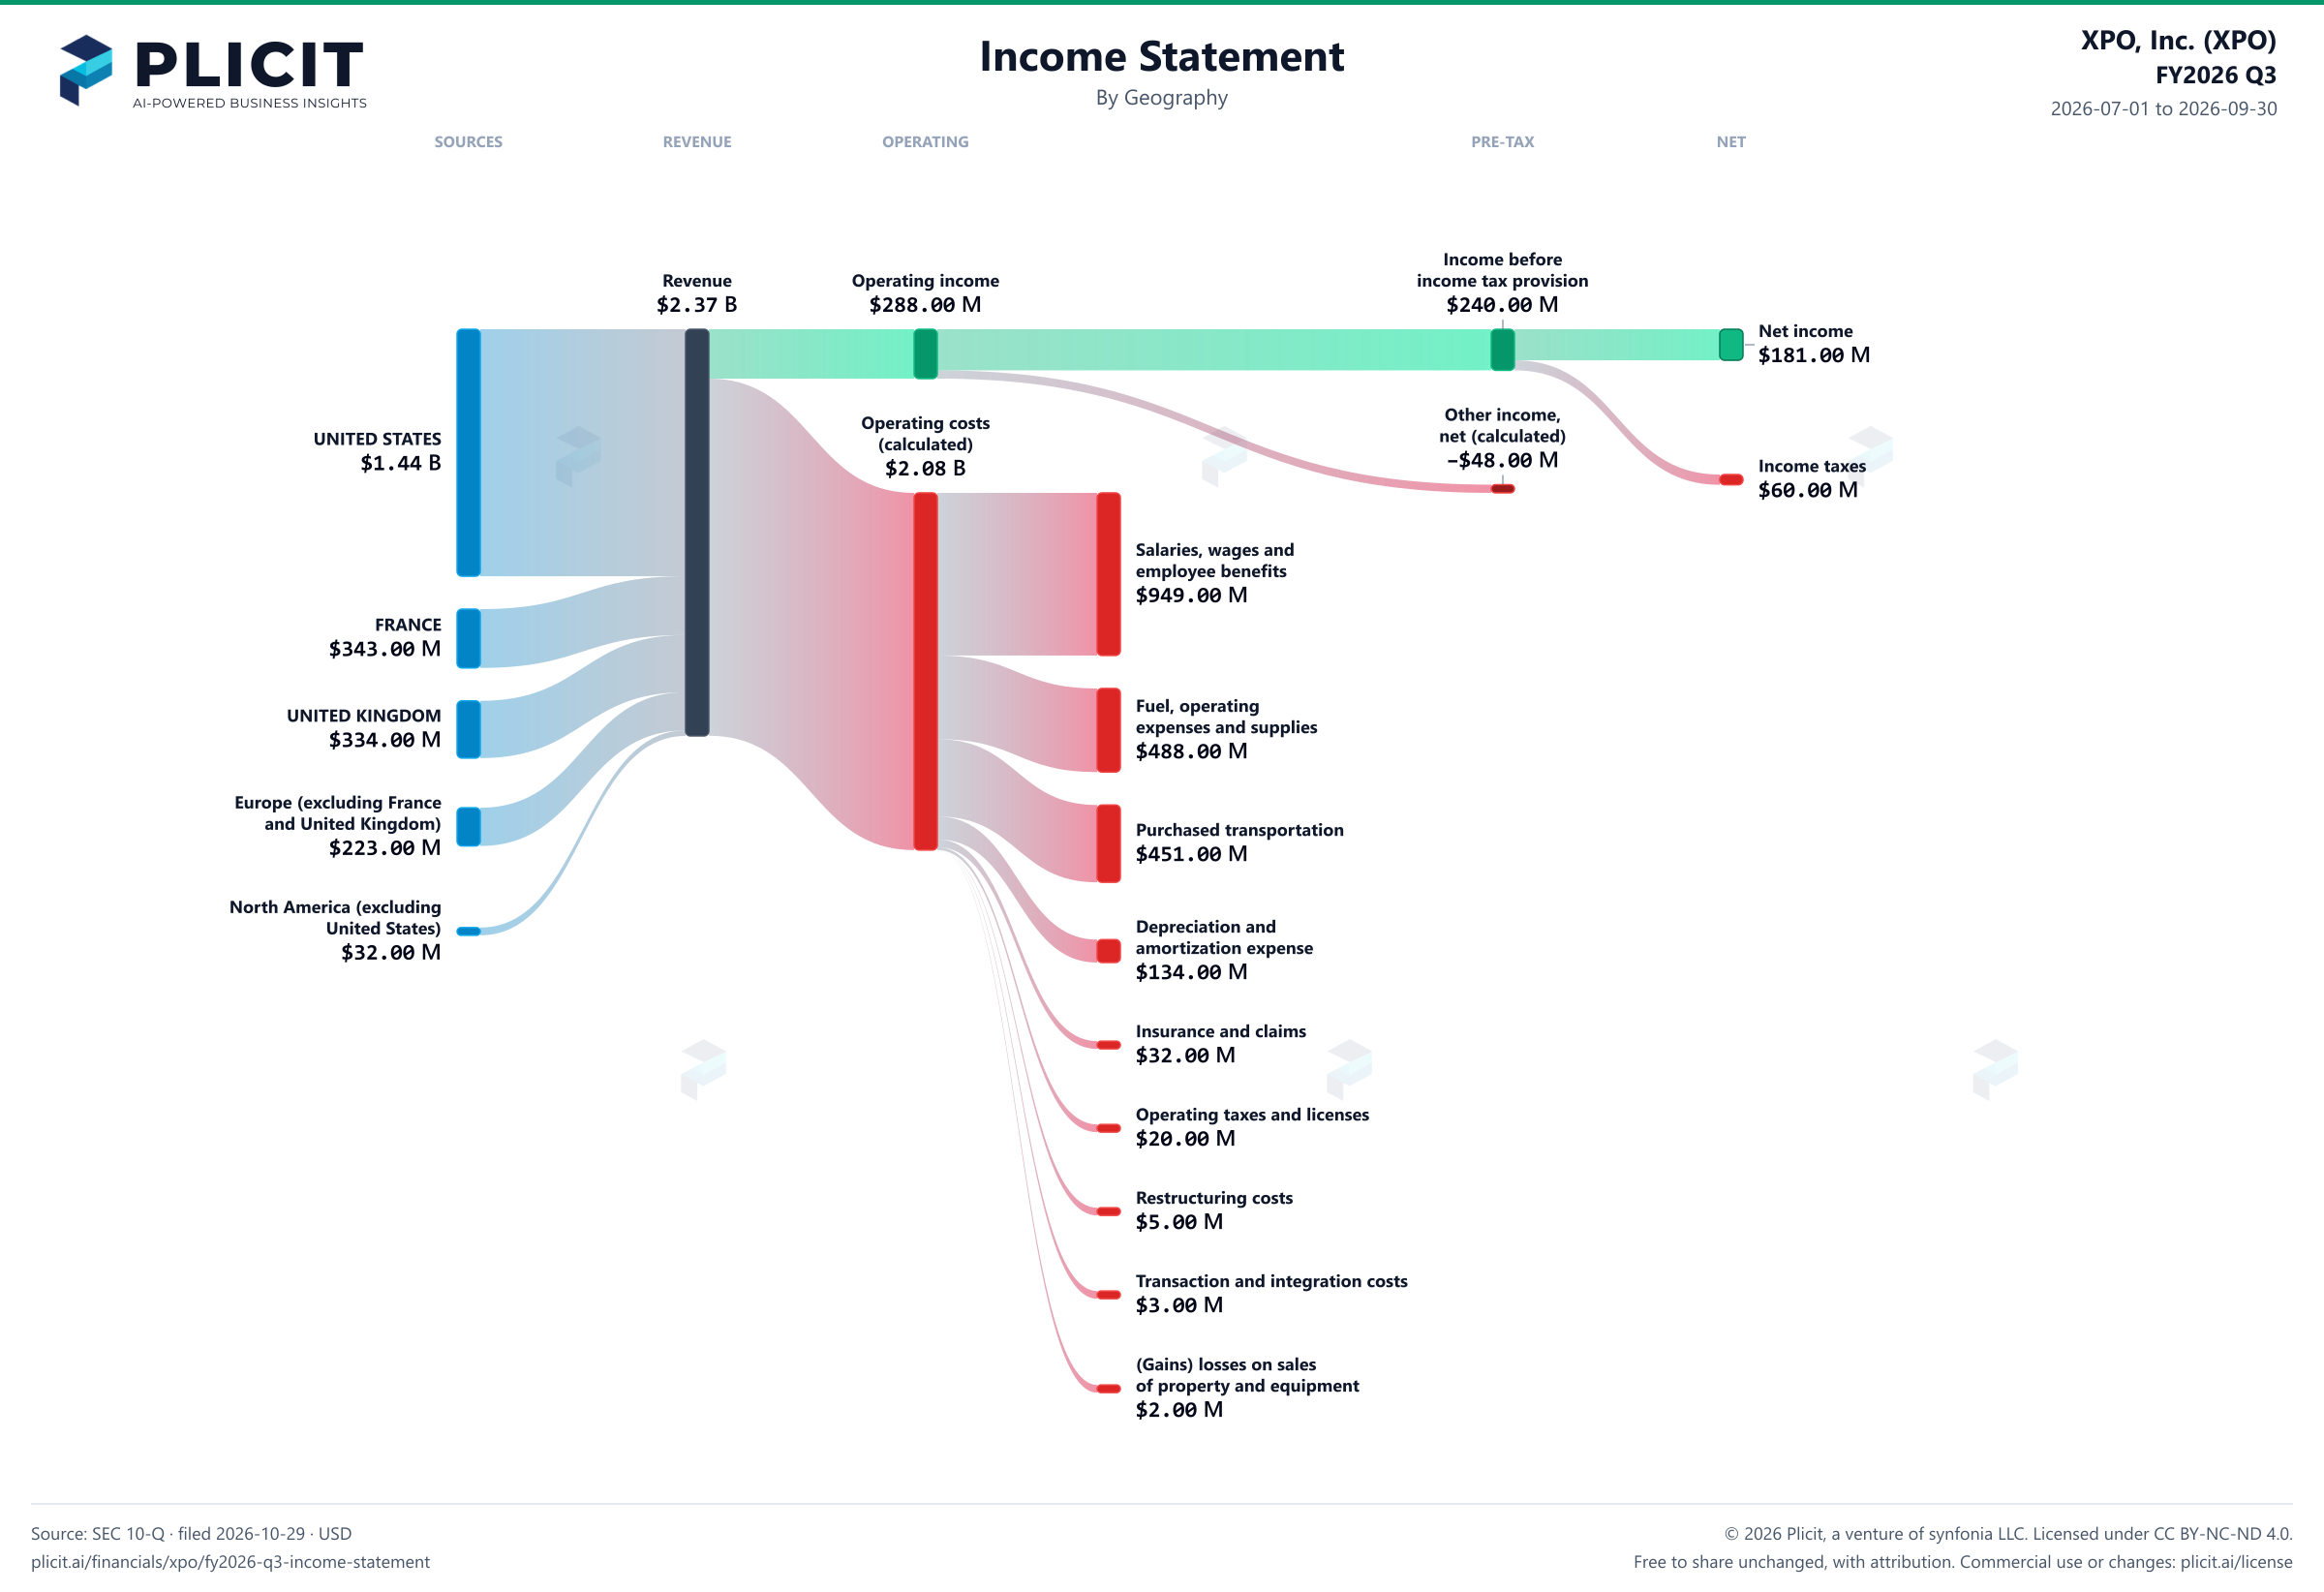
  • The United States brought in $1.44 B, 61% of sales, against 14% for France.
  • Sales from outside the United States reached $932.00 M, or 39% of the total.
  • North America outside the US grew 19%, the fastest of any part of sales by region.
  • Europe outside France and the United Kingdom grew only 1.4%, against 12% for revenue as a whole.
  • The US added $213.00 M of the $262.00 M rise in revenue from a year earlier.

The Unvarnished Truth

61% of XPO's quarterly sales come from the United States

Most of XPO's sales come from one country, and that share grew. The United States brought in $1.44 B this quarter, or 61% of the $2.37 B total. A year earlier its share was 58%. The US added $213.00 M of the $262.00 M rise in revenue, so the growth came mostly from home. France and the United Kingdom followed at 14% each, far behind. The filing's own revenue table prints the same US figure, so the split is not an estimate. The rest of the map is a long tail of small markets.

Why does the map matter? Sales abroad are often earned in other currencies, so exchange-rate swings can nudge the reported totals. Outside the United States, sales were $932.00 M, or 39% of the total, and they are the part most exposed to swings. Europe outside France and the United Kingdom grew only 1.4%, while North America outside the US grew 19% from a small base of $32.00 M. The filing says foreign currency movement decreased revenue by approximately 0.6 percentage points in the third quarter.

For a reader, the map says XPO is an American business with a European sideline. The growth sits at home, in the United States. The filing assigns sales by the location of the sales office, not by where the freight moves, which matters for a freight company. Its board's authorization to divest the European business remains in effect, so that sideline may not stay. What would settle it: will the United States keep carrying the growth, or will France and the United Kingdom catch up before any sale?
2026-07-01 to 2026-09-30

Revenue by Geography

Swipe to see the full flow
XPO, Inc. (XPO) FY2026 Q3 P&L / Income StatementIncome statement for 2026-07-01 through 2026-09-30. View: Geography. Revenue uses this breakdown; costs and expenses retain the consolidated categories.SOURCESREVENUEOPERATINGPRE-TAXNETUNITED STATESFRANCEUNITED KINGDOMEurope (excluding France and United Kingdom)North America (excluding United States)RevenueOperating incomeOperating costs, including other operating expenses (calculated)Salaries, wages and employee benefitsFuel, operating expenses and suppliesPurchased transportationDepreciation and amortization expenseInsurance and claimsOperating taxes and licensesRestructuring costsTransaction and integration costs(Gains) losses on sales of property and equipmentIncome before income tax provisionOther income (expense), net (calculated)Net incomeIncome tax provisionIncome before income tax provisionIncome beforeincome tax provision$240.00 MRevenueRevenue$2.37 BOperating incomeOperating income$288.00 MNet incomeNet income$181.00 MOperating costs, including other operating expenses (calculated)Operating costs(calculated)$2.08 BUNITED STATESUNITED STATES$1.44 BIncome tax provisionIncome taxes$60.00 MOther income (expense), net (calculated)Other income,net (calculated)−$48.00 MSalaries, wages and employee benefitsSalaries, wages andemployee benefits$949.00 MFRANCEFRANCE$343.00 MFuel, operating expenses and suppliesFuel, operatingexpenses and supplies$488.00 MUNITED KINGDOMUNITED KINGDOM$334.00 MEurope (excluding France and United Kingdom)Europe (excluding Franceand United Kingdom)$223.00 MPurchased transportationPurchased transportation$451.00 MNorth America (excluding United States)North America (excludingUnited States)$32.00 MDepreciation and amortization expenseDepreciation andamortization expense$134.00 MInsurance and claimsInsurance and claims$32.00 MOperating taxes and licensesOperating taxes and licenses$20.00 MRestructuring costsRestructuring costs$5.00 MTransaction and integration costsTransaction and integration costs$3.00 M(Gains) losses on sales of property and equipment(Gains) losses on salesof property and equipment$2.00 M
Chart details

XPO, Inc. (XPO) FY2026 Q3 P&L / Income Statement

Income statement for 2026-07-01 through 2026-09-30. View: Geography. Revenue uses this breakdown; costs and expenses retain the consolidated categories.

Revenue
2,373,000,000 US dollars
Operating costs, including other operating expenses (calculated)
2,084,000,000 US dollars
Operating income
288,000,000 US dollars
Other income (expense), net (calculated)
negative 48,000,000 US dollars
Income before income tax provision
240,000,000 US dollars
Income tax provision
60,000,000 US dollars
Net income
181,000,000 US dollars
UNITED STATES
1,441,000,000 US dollars
North America (excluding United States)
32,000,000 US dollars
FRANCE
343,000,000 US dollars
UNITED KINGDOM
334,000,000 US dollars
Europe (excluding France and United Kingdom)
223,000,000 US dollars
Fuel, operating expenses and supplies
488,000,000 US dollars
Insurance and claims
32,000,000 US dollars
Operating taxes and licenses
20,000,000 US dollars
Purchased transportation
451,000,000 US dollars
Restructuring costs
5,000,000 US dollars
Salaries, wages and employee benefits
949,000,000 US dollars
Transaction and integration costs
3,000,000 US dollars
(Gains) losses on sales of property and equipment
2,000,000 US dollars
Depreciation and amortization expense
134,000,000 US dollars
Legal matters
0 US dollars
Pre-Con-way acquisition environmental matter
0 US dollars

Chart connections

  • Revenue minus operating expenses equals operating income.
  • Operating income plus other income or expense equals income before tax. Income before tax less income tax expense or benefit equals net income.
  • The amounts that make up operating profit come to $289.00 M and operating profit is $288.00 M; the $1.00 M difference is within the rounding of the filed amounts.
  • The amounts that make up net income come to $180.00 M and net income is $181.00 M; the $1.00 M difference is within the rounding of the filed amounts.
XPO, Inc. (XPO) FY2026 Q3 Revenue by Geography Sankey chart
Free to share unchanged, with credit to Plicit.ai · CC BY-NC-ND 4.0Download PNG

Intelligent Insights for Investors

How much of XPO's sales come from outside its home country?

Less than half: $932.00 M, or 39% of sales this quarter, came from outside the United States. Sales abroad are often earned in other currencies, so exchange-rate swings can nudge the reported totals.

Which parts of XPO's sales by region drove the change over the past year?

Mostly the United States: it added $213.00 M of the $262.00 M rise in revenue (what it earned from customers for its products and services, whether or not they have paid yet) from a year earlier.

Intelligent Insights for Everyone

Where in the world does XPO make its sales?

The map tilts toward the United States, which supplied 61% of sales this quarter; France, in second place, supplied 14%.

Product waitlist

Health Check and Teardown for your own company

A health check uncovers insights of your private books, not a public ticker. Join this list to get notified as soon as we go-live!