
ASBURY AUTOMOTIVE GROUP, INC. (ABG) FY2026 Q3 P&L / Income Statement

Published Source: Form 10-Q on SEC EDGAR filed (opens in a new tab)

Key Takeaways

  • Dealerships brought in 98% of sales, and TCA's $82.60 M is a distant second.
  • TCA kept 25% of its sales as operating income, against 4.2% for Dealerships.
  • Dealerships' operating income fell $32.30 M from a year earlier, while TCA's rose.
  • TCA earns 1.9% on $1.10 B of assets, close to the 1.8% that Dealerships earns on $10.06 B.
  • Operating income of $206.60 M exceeds the segments' $202.30 M, so head-office items added $4.30 M.

The Unvarnished Truth

Dealerships make 98% of sales at a 4.2% operating margin

Asbury Automotive's dealerships are nearly the whole business. They brought in $4.33 B of revenue this quarter, 98% of the total. TCA brought in $82.60 M. Dealerships kept 4.2% of their sales as operating income, while TCA kept 25%. The two businesses sum to the consolidated total, so little is left for anything else to explain. Every other part of the company is too small to move these figures much. That is the picture to hold before reading the profit story.

Why did profit fall? Dealerships' operating income dropped $32.30 M, from $213.90 M to $181.60 M, while TCA's rose from $19.60 M to $20.70 M. Combined, the segments' operating profit fell $31.20 M. The combined margin slipped 0.3 percentage points, and the business mix barely moved, so the decline came from inside the businesses. The profit line is the one that moved, and it moved in the dealerships. Dealerships' profit fell 15.1% while its sales fell 8.2%.

TCA earns 1.9% on $1.10 B of assets, almost the same return as Dealerships' 1.8% on $10.06 B. The margin gap is about sales, not capital. TCA is by far the smaller business, so its 25% margin adds only a little to the company total. The dealerships, which hold 90% of the assets, set the company's return on capital. Will TCA's 25% margin hold as its product revenue is earned over the life of each contract?
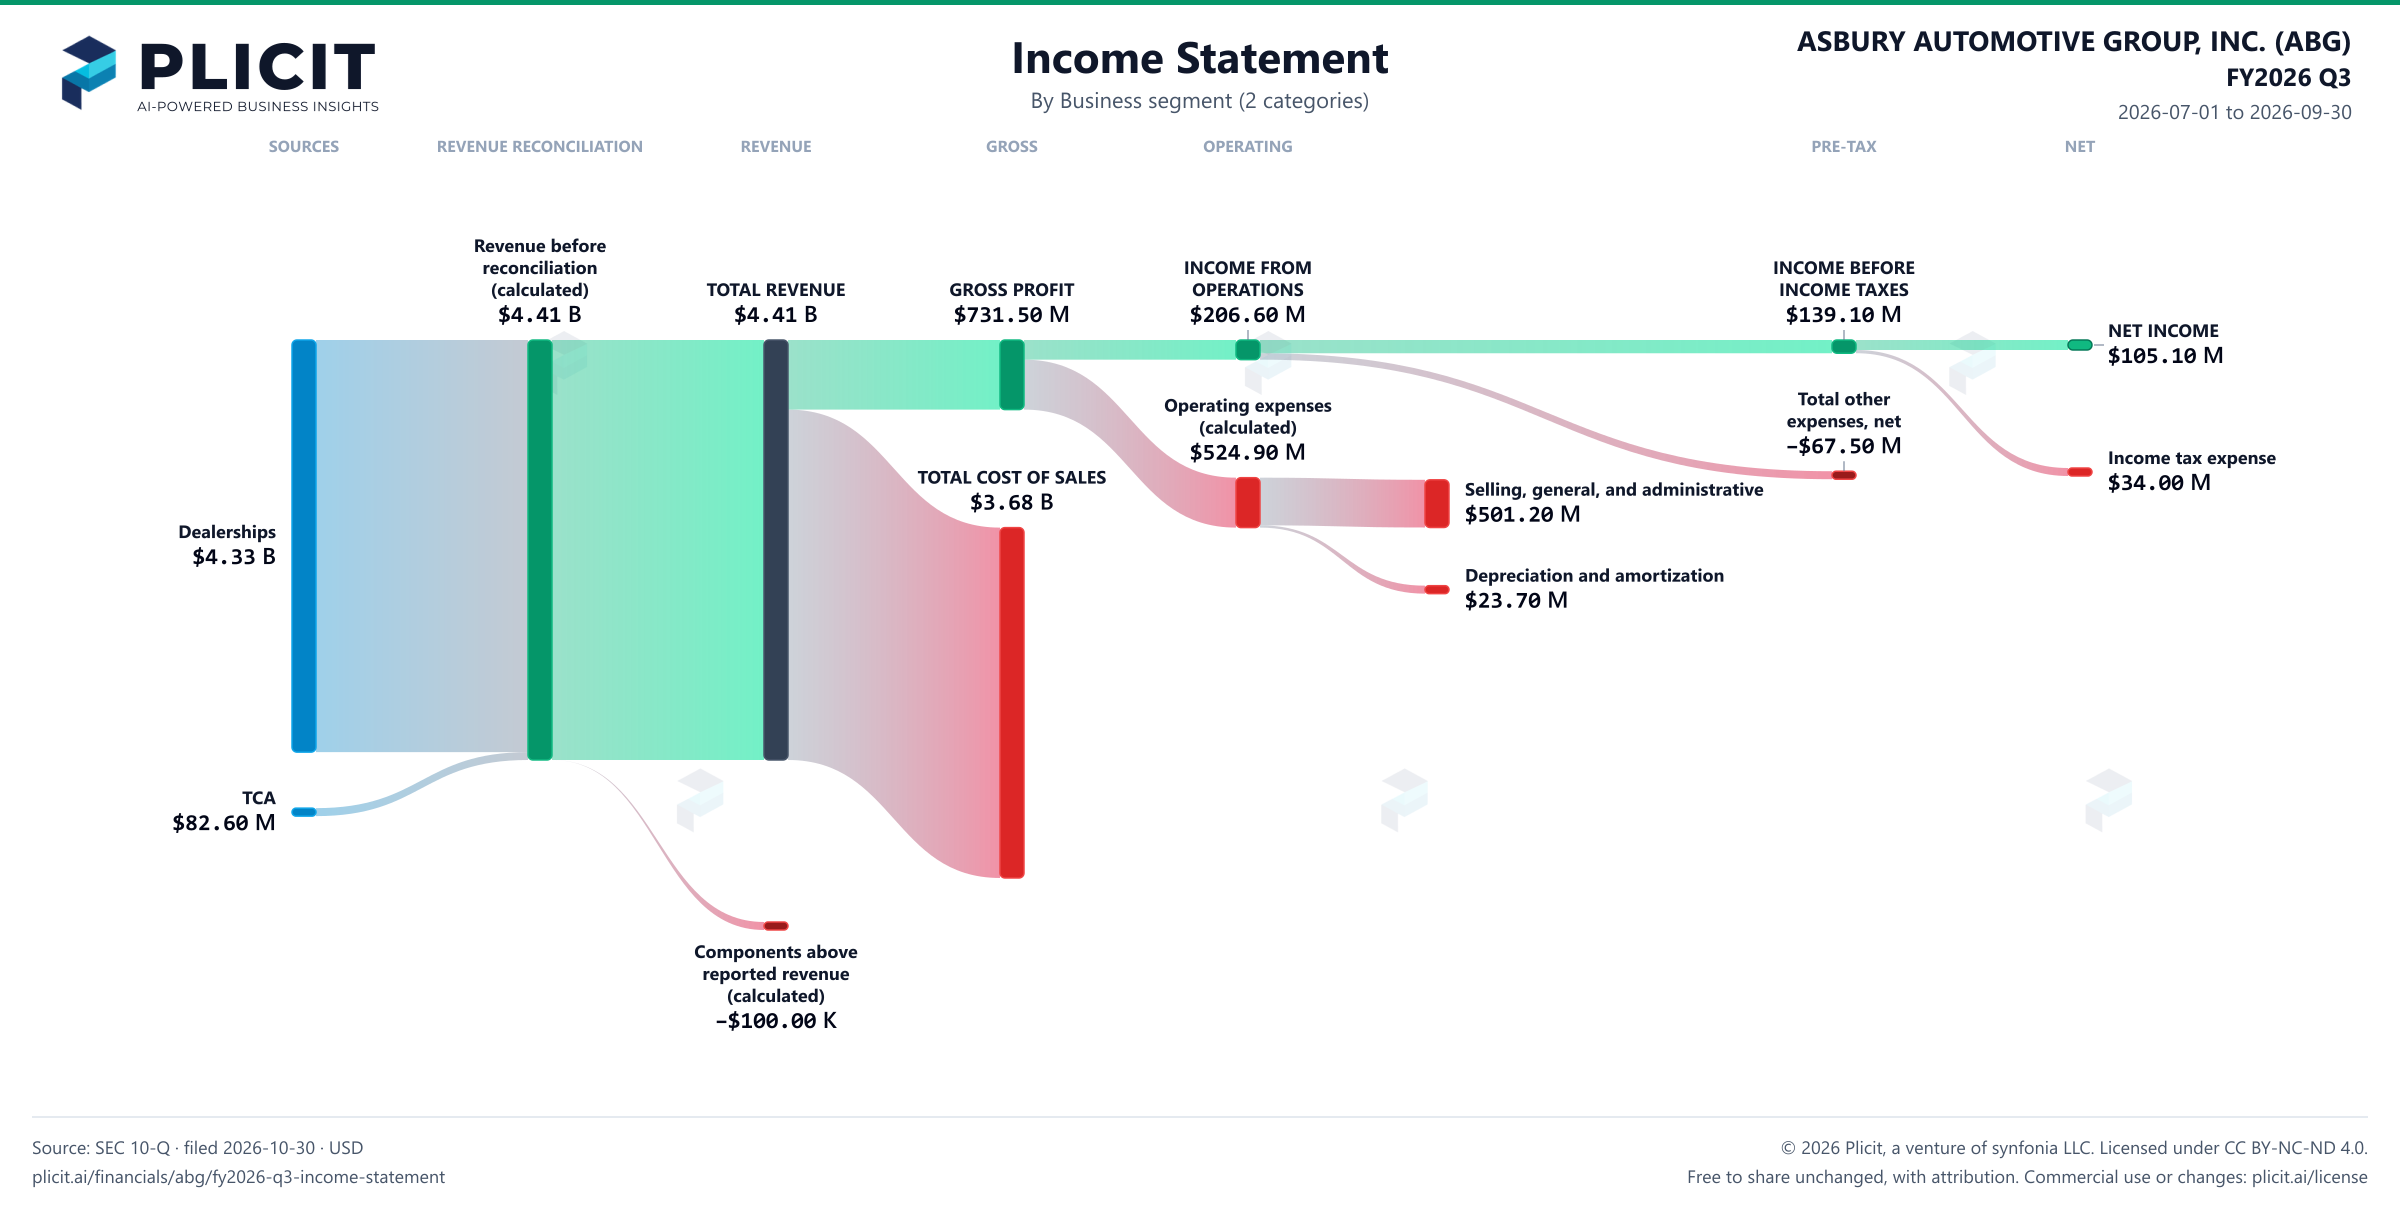
Revenue by Business Segment (2 categories)

Swipe to see the full flow
ASBURY AUTOMOTIVE GROUP, INC. (ABG) FY2026 Q3 P&L / Income StatementIncome statement for 2026-07-01 through 2026-09-30. View: Business segment (2 categories). Revenue uses this breakdown; costs and expenses retain the consolidated categories.SOURCESREVENUE RECONCILIATIONREVENUEGROSSOPERATINGPRE-TAXNETDealershipsTCATOTAL REVENUERevenue before reconciliation (calculated)Components above reported revenue (calculated)GROSS PROFITTOTAL COST OF SALESINCOME FROM OPERATIONSOperating expenses (calculated)Selling, general, and administrativeDepreciation and amortizationINCOME BEFORE INCOME TAXESTotal other expenses, netNET INCOMEIncome tax expenseRevenue before reconciliation (calculated)Revenue beforereconciliation(calculated)$4.41 BINCOME FROM OPERATIONSINCOME FROMOPERATIONS$206.60 MINCOME BEFORE INCOME TAXESINCOME BEFOREINCOME TAXES$139.10 MTOTAL REVENUETOTAL REVENUE$4.41 BGROSS PROFITGROSS PROFIT$731.50 MNET INCOMENET INCOME$105.10 MOperating expenses (calculated)Operating expenses(calculated)$524.90 MIncome tax expenseIncome tax expense$34.00 MTOTAL COST OF SALESTOTAL COST OF SALES$3.68 BSelling, general, and administrativeSelling, general, and administrative$501.20 MTotal other expenses, netTotal otherexpenses, net−$67.50 MDealershipsDealerships$4.33 BDepreciation and amortizationDepreciation and amortization$23.70 MTCATCA$82.60 MComponents above reported revenue (calculated)Components abovereported revenue(calculated)−$100.00 K
Chart details

ASBURY AUTOMOTIVE GROUP, INC. (ABG) FY2026 Q3 P&L / Income Statement

Income statement for 2026-07-01 through 2026-09-30. View: Business segment (2 categories). Revenue uses this breakdown; costs and expenses retain the consolidated categories.

TOTAL REVENUE
4,413,600,000 US dollars
TOTAL COST OF SALES
3,682,100,000 US dollars
GROSS PROFIT
731,500,000 US dollars
Operating expenses (calculated)
524,900,000 US dollars
INCOME FROM OPERATIONS
206,600,000 US dollars
Total other expenses, net
negative 67,500,000 US dollars
INCOME BEFORE INCOME TAXES
139,100,000 US dollars
Income tax expense
34,000,000 US dollars
NET INCOME
105,100,000 US dollars
Dealerships
4,331,100,000 US dollars
TCA
82,600,000 US dollars
Selling, general, and administrative
501,200,000 US dollars
Depreciation and amortization
23,700,000 US dollars
Asset impairments
0 US dollars
Revenue before reconciliation (calculated)
4,413,700,000 US dollars. Sum of the reported revenue categories before the separately reported reconciliation.
Components above reported revenue (calculated)
negative 100,000 US dollars. The disclosed components add up to more than reported revenue; this is the difference, calculated, not a reported item.
Dealerships costs (calculated)
4,226,100,000 US dollars. Segment revenue less segment operating income; it includes cost of revenue and operating expenses.
TCA costs (calculated)
61,900,000 US dollars. Segment revenue less segment operating income; it includes cost of revenue and operating expenses.
Reconciling items (calculated)
negative 81,000,000 US dollars. Segment revenue less segment operating income; it includes cost of revenue and operating expenses.

Chart connections

  • Revenue less cost of revenue equals gross profit; gross profit less operating expenses equals operating income.
  • Operating income plus other income or expense equals income before tax. Income before tax less income tax expense or benefit equals net income.
  • Reported revenue categories plus the separately reported signed reconciliation equals consolidated revenue.
ASBURY AUTOMOTIVE GROUP, INC. (ABG) FY2026 Q3 Revenue by Business Segment (2 categories) Sankey chart
Free to share unchanged, with credit to Plicit.ai · CC BY-NC-ND 4.0Download PNG

Intelligent Insights for Investors

How profitable is each of Asbury Automotive's businesses?

All of its businesses (the parts it reports on separately) made money this quarter, with TCA keeping the most of each sales dollar as operating income, 25%, and Dealerships the least, 4.2%.

Which of Asbury Automotive's businesses drove its profit change over the past year?

Dealerships alone: it lost $32.30 M from a year earlier, more than its businesses' combined operating profit fell overall, because TCA moved the other way.

Which of Asbury Automotive's businesses earns the highest return on its assets?

TCA: its operating income this quarter came to 1.9% of its assets, against 1.8% at Dealerships.

Intelligent Insights for Lenders

Is Asbury Automotive putting its money into its most profitable business?

Yes: Dealerships, which earned 90% of the operating income its businesses reported this quarter, also holds the most assets, 90% of theirs.

Intelligent Insights for Employees

Which of Asbury Automotive's businesses brings in the most sales?

It's Dealerships, and it isn't close: $4.33 B of the $4.41 B total this quarter, with TCA a distant second.

Product waitlist

Health Check and Teardown for your own company

A health check uncovers insights of your private books, not a public ticker. Join this list to get notified as soon as we go-live!