
CARPENTER TECHNOLOGY CORPORATION (CRS) FY2027 Q1 P&L / Income Statement

Published · Updated Source: Form 10-Q on SEC EDGAR filed (opens in a new tab)

Key Takeaways

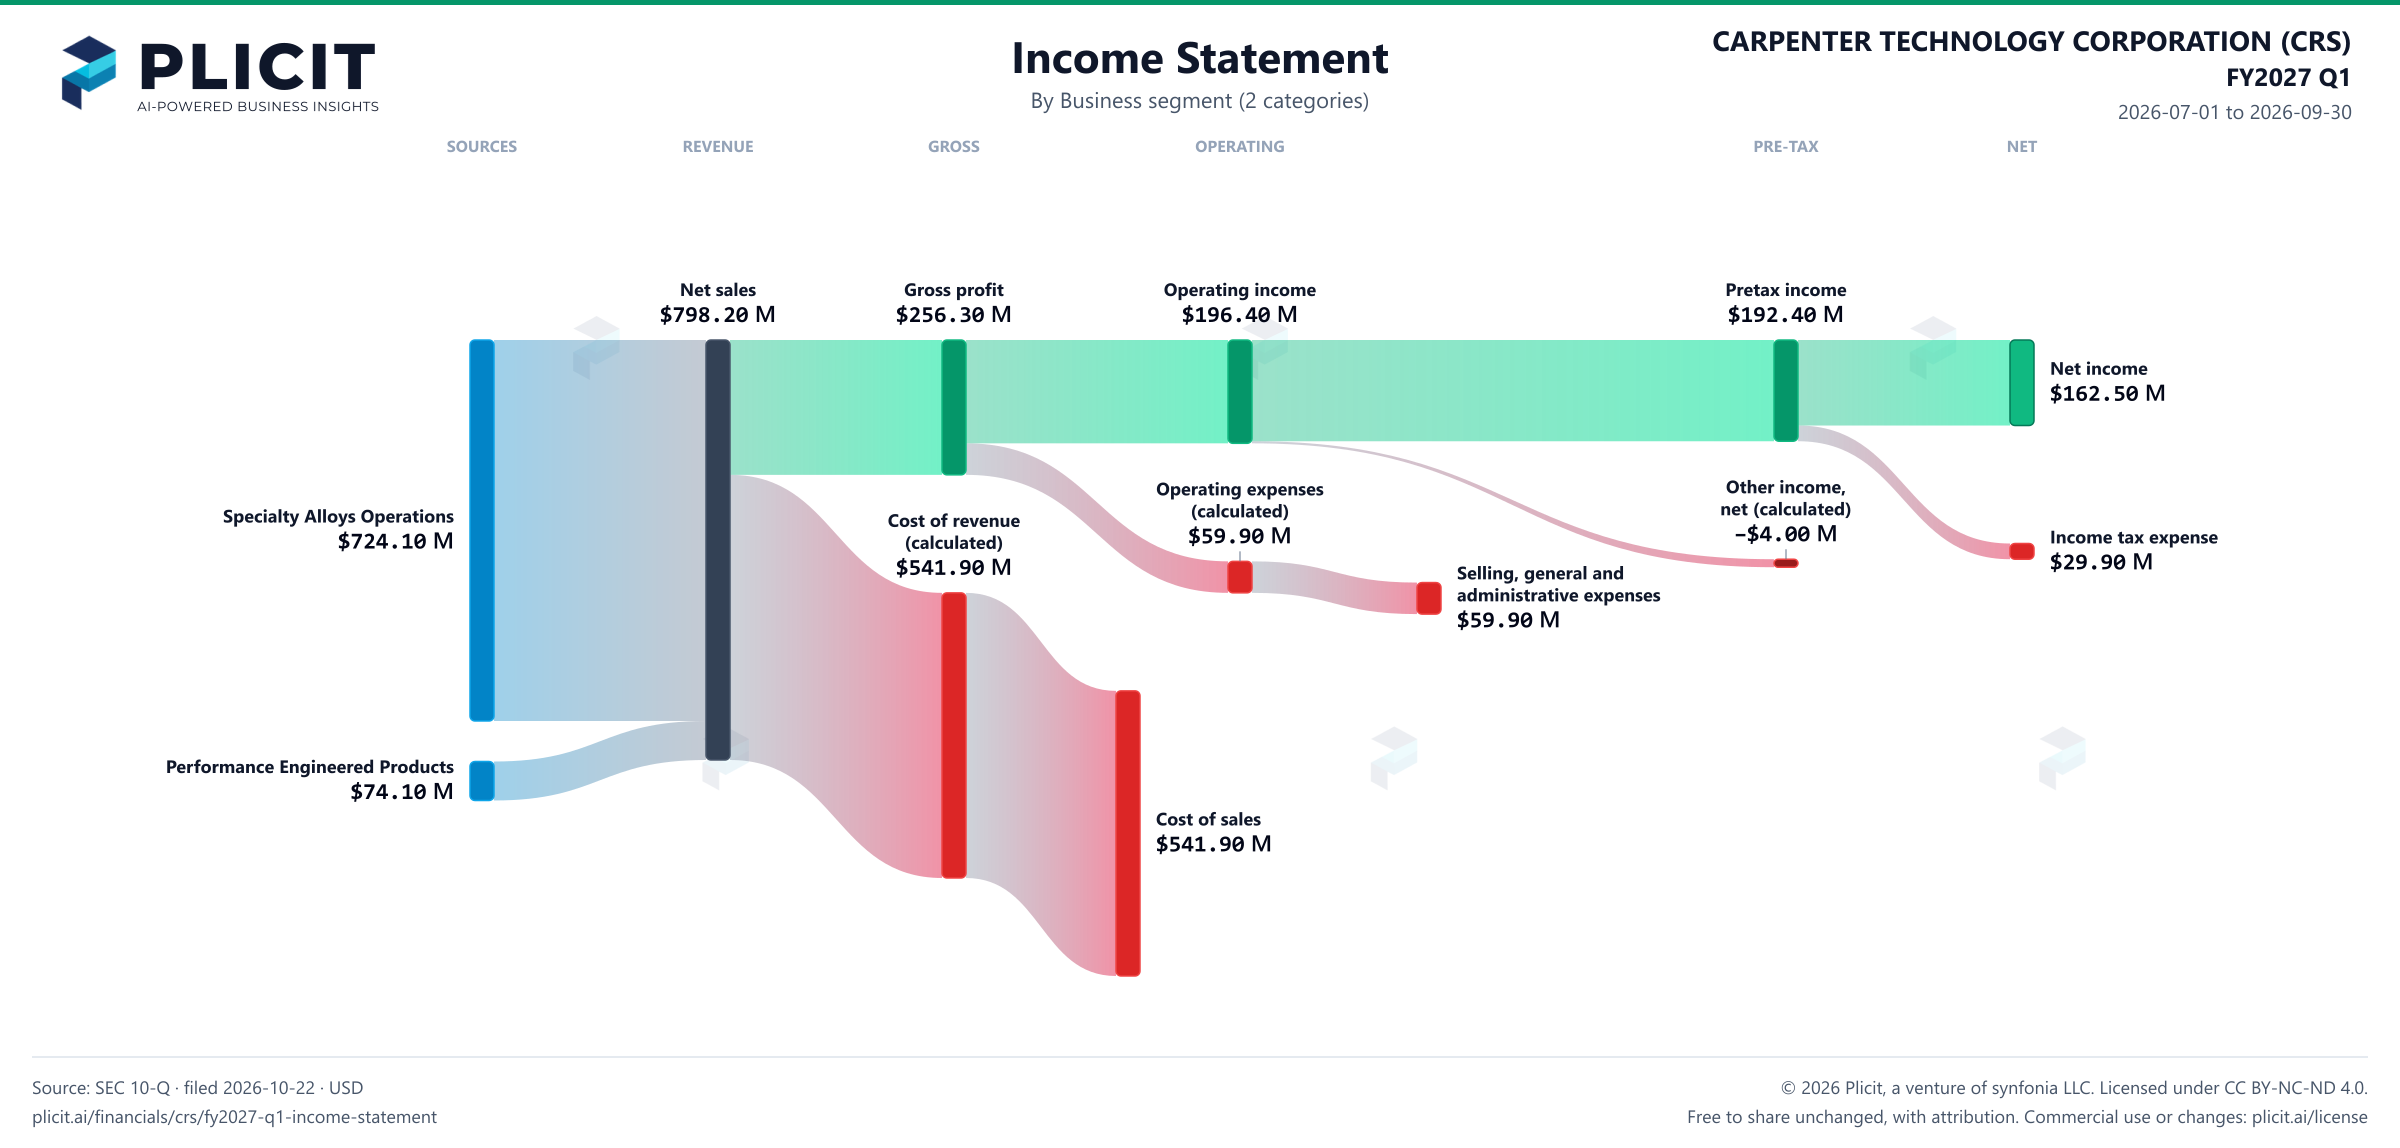
  • Specialty Alloys Operations brought in $724.10 M of the $798.20 M in sales this quarter.
  • Performance Engineered Products shrank 4.5%, to $74.10 M, while its profit fell 22% to $7.30 M.
  • Specialty Alloys Operations kept a 30% operating margin, and its $216.30 M is 97% of segment profit.
  • Head-office costs and other items outside the businesses took $27.20 M, leaving $196.40 M.

The Unvarnished Truth

Specialty Alloys brings in 91% of sales and 97% of segment profit

Specialty Alloys Operations brought in 91% of Carpenter Technology's sales this quarter, and it produced 97% of the operating income its businesses reported. The other business, Performance Engineered Products, earned a 9.9% margin against 30% for its larger sibling. Its operating income fell 22% to $7.30 M, while the big unit's rose $45.60 M to $216.30 M. Head-office costs and other items outside the businesses then took $27.20 M, leaving $196.40 M. Why did the smaller business lose profit while the larger one gained?

Growth is concentrated: the leading unit's sales rose 10% to $724.10 M, against 9% for the company as a whole. Performance Engineered Products went the other way, slipping 4.5% to $74.10 M. It also sold $17.00 M to other parts of the company, 19% of its sales counting those internal ones. Sales and profit point the same way, which makes the picture one-sided. Does the smaller unit's sales loss reflect weaker demand, or is it a product of how the group moves its own sales between businesses?

Investors are, in effect, buying a bet on one business, and the numbers say so. Specialty Alloys Operations earns 7.0% on its $3.10 B of assets, while Performance Engineered Products earns 1.8% on $398.30 M. Its combined operating margin rose 3.5 points over the year, which is the one bright line in a story of concentration. A reader who holds the stock needs to know which business is carrying the margin and which is carrying the risk. Will the smaller unit's decline keep pulling sales down, or is the margin gain here to stay?
Revenue by Business Segment (2 categories)

Swipe to see the full flow
CARPENTER TECHNOLOGY CORPORATION (CRS) FY2027 Q1 P&L / Income StatementIncome statement for 2026-07-01 through 2026-09-30. View: Business segment (2 categories). Revenue uses this breakdown; costs and expenses retain the consolidated categories.SOURCESREVENUEGROSSOPERATINGPRE-TAXNETSpecialty Alloys OperationsPerformance Engineered ProductsNet salesGross profitCost of revenue (calculated)Cost of salesOperating incomeOperating expenses (calculated)Selling, general and administrative expensesIncome before income taxesOther income (expense), net (calculated)Net incomeIncome tax expenseNet salesNet sales$798.20 MGross profitGross profit$256.30 MOperating incomeOperating income$196.40 MIncome before income taxesPretax income$192.40 MNet incomeNet income$162.50 MOperating expenses (calculated)Operating expenses(calculated)$59.90 MSpecialty Alloys OperationsSpecialty Alloys Operations$724.10 MCost of revenue (calculated)Cost of revenue(calculated)$541.90 MIncome tax expenseIncome tax expense$29.90 MSelling, general and administrative expensesSelling, general andadministrative expenses$59.90 MOther income (expense), net (calculated)Other income,net (calculated)−$4.00 MPerformance Engineered ProductsPerformance Engineered Products$74.10 MCost of salesCost of sales$541.90 M
Chart details

CARPENTER TECHNOLOGY CORPORATION (CRS) FY2027 Q1 P&L / Income Statement

Income statement for 2026-07-01 through 2026-09-30. View: Business segment (2 categories). Revenue uses this breakdown; costs and expenses retain the consolidated categories.

Net sales
798,200,000 US dollars
Cost of revenue (calculated)
541,900,000 US dollars
Gross profit
256,300,000 US dollars
Operating expenses (calculated)
59,900,000 US dollars
Operating income
196,400,000 US dollars
Other income (expense), net (calculated)
negative 4,000,000 US dollars
Income before income taxes
192,400,000 US dollars
Income tax expense
29,900,000 US dollars
Net income
162,500,000 US dollars
Specialty Alloys Operations
724,100,000 US dollars
Performance Engineered Products
74,100,000 US dollars
Cost of sales
541,900,000 US dollars
Selling, general and administrative expenses
59,900,000 US dollars
Specialty Alloys Operations costs (calculated)
514,100,000 US dollars. Segment revenue less segment operating income; it includes cost of revenue and operating expenses.
Performance Engineered Products costs (calculated)
83,800,000 US dollars. Segment revenue less segment operating income; it includes cost of revenue and operating expenses.
Reconciling items (calculated)
3,900,000 US dollars. Segment revenue less segment operating income; it includes cost of revenue and operating expenses.

Chart connections

  • Revenue less cost of revenue equals gross profit; gross profit less operating expenses equals operating income.
  • Operating income plus other income or expense equals income before tax. Income before tax less income tax expense or benefit equals net income.
CARPENTER TECHNOLOGY CORPORATION (CRS) FY2027 Q1 Revenue by Business Segment (2 categories) Sankey chart
Free to share unchanged, with credit to Plicit.ai · CC BY-NC-ND 4.0Download PNG

Intelligent Insights for Investors

Which of Carpenter Technology's businesses brings in the most sales?

Specialty Alloys Operations is the largest business by far: it brought in 91% of sales this quarter, against 9.3% for Performance Engineered Products.

How profitable is each of Carpenter Technology's businesses?

Margins run from 9.9% at Performance Engineered Products to 30% at Specialty Alloys Operations this quarter, measured as operating income per dollar of sales. That shows where the company earns the most on each dollar it sells.

Which of Carpenter Technology's businesses drove its profit change over the past year?

All of the gain, and then some, came from Specialty Alloys Operations, whose operating income rose $45.60 M to $216.30 M. Performance Engineered Products fell $2.10 M, trimming the combined rise.

Intelligent Insights for Lenders

Which of Carpenter Technology's businesses earns the highest return on its assets?

Specialty Alloys Operations: its operating income this quarter came to 7.0% of its assets, against 1.8% at Performance Engineered Products. That makes the larger business the stronger use of the capital assigned to it, on this measure.

Intelligent Insights for Suppliers

How much does Carpenter Technology depend on the biggest piece of its sales by business?

The dependence is heavy: Specialty Alloys Operations brought in 91% of these sales this quarter, against 9% for Performance Engineered Products. Anything that hits that unit hits most of the sales.

Product waitlist

Health Check and Teardown for your own company

A health check uncovers insights of your private books, not a public ticker. Join this list to get notified as soon as we go-live!