
CARPENTER TECHNOLOGY CORPORATION (CRS) FY2027 Q1 P&L / Income Statement

Published · Updated Source: Form 10-Q on SEC EDGAR filed (opens in a new tab)

Key Takeaways

  • Mexico's revenue rose from $24.80 M to $48.80 M, nearly doubling in a year.
  • Europe slipped from $166.20 M to $155.50 M, the biggest drop of any region.
  • The United States supplied 58% of sales, and it added $32.20 M of the $64.50 M rise in revenue.
  • The United States holds 100% of long-term assets but brings in only 58% of sales.

The Unvarnished Truth

Mexico's sales nearly doubled while Europe's shrank 6.4% in one year

Mexico's sales nearly doubled in a year, from $24.80 M to $48.80 M, while Europe's fell 6.4% to $155.50 M. Europe is the second-largest region, and its loss of $10.70 M was the largest drop of any region. Those moves came while total revenue grew 8.8%. The United States, at 58% of sales, added $32.20 M, so about half of the $64.50 M rise came from the home market. Is Mexico's jump a new customer base, or is it a one-off that the next quarter will erase?

Why did one region shrink while the company grew 8.8%? The region view shows where the change landed, not what caused it. The United States grew by $32.20 M, half of the rise, while Europe gave back $10.70 M. Mexico added $24.00 M on its own, a rise that alone would explain more than a third of the total. Which of those moves is the real story, and which is noise? The next filing will show whether the pattern holds.

Carpenter Technology's exposure is concentrated: 58% of sales and 100% of long-term assets sit in the United States. So currency and foreign demand touch the 42% of sales made abroad, while the factories stay put. Europe is shrinking and Mexico is climbing, and that shift matters for how exposed the company is to any one economy. If that trend continues, does the company's exposure shift toward its neighbor, and what does that mean for its currency risk?
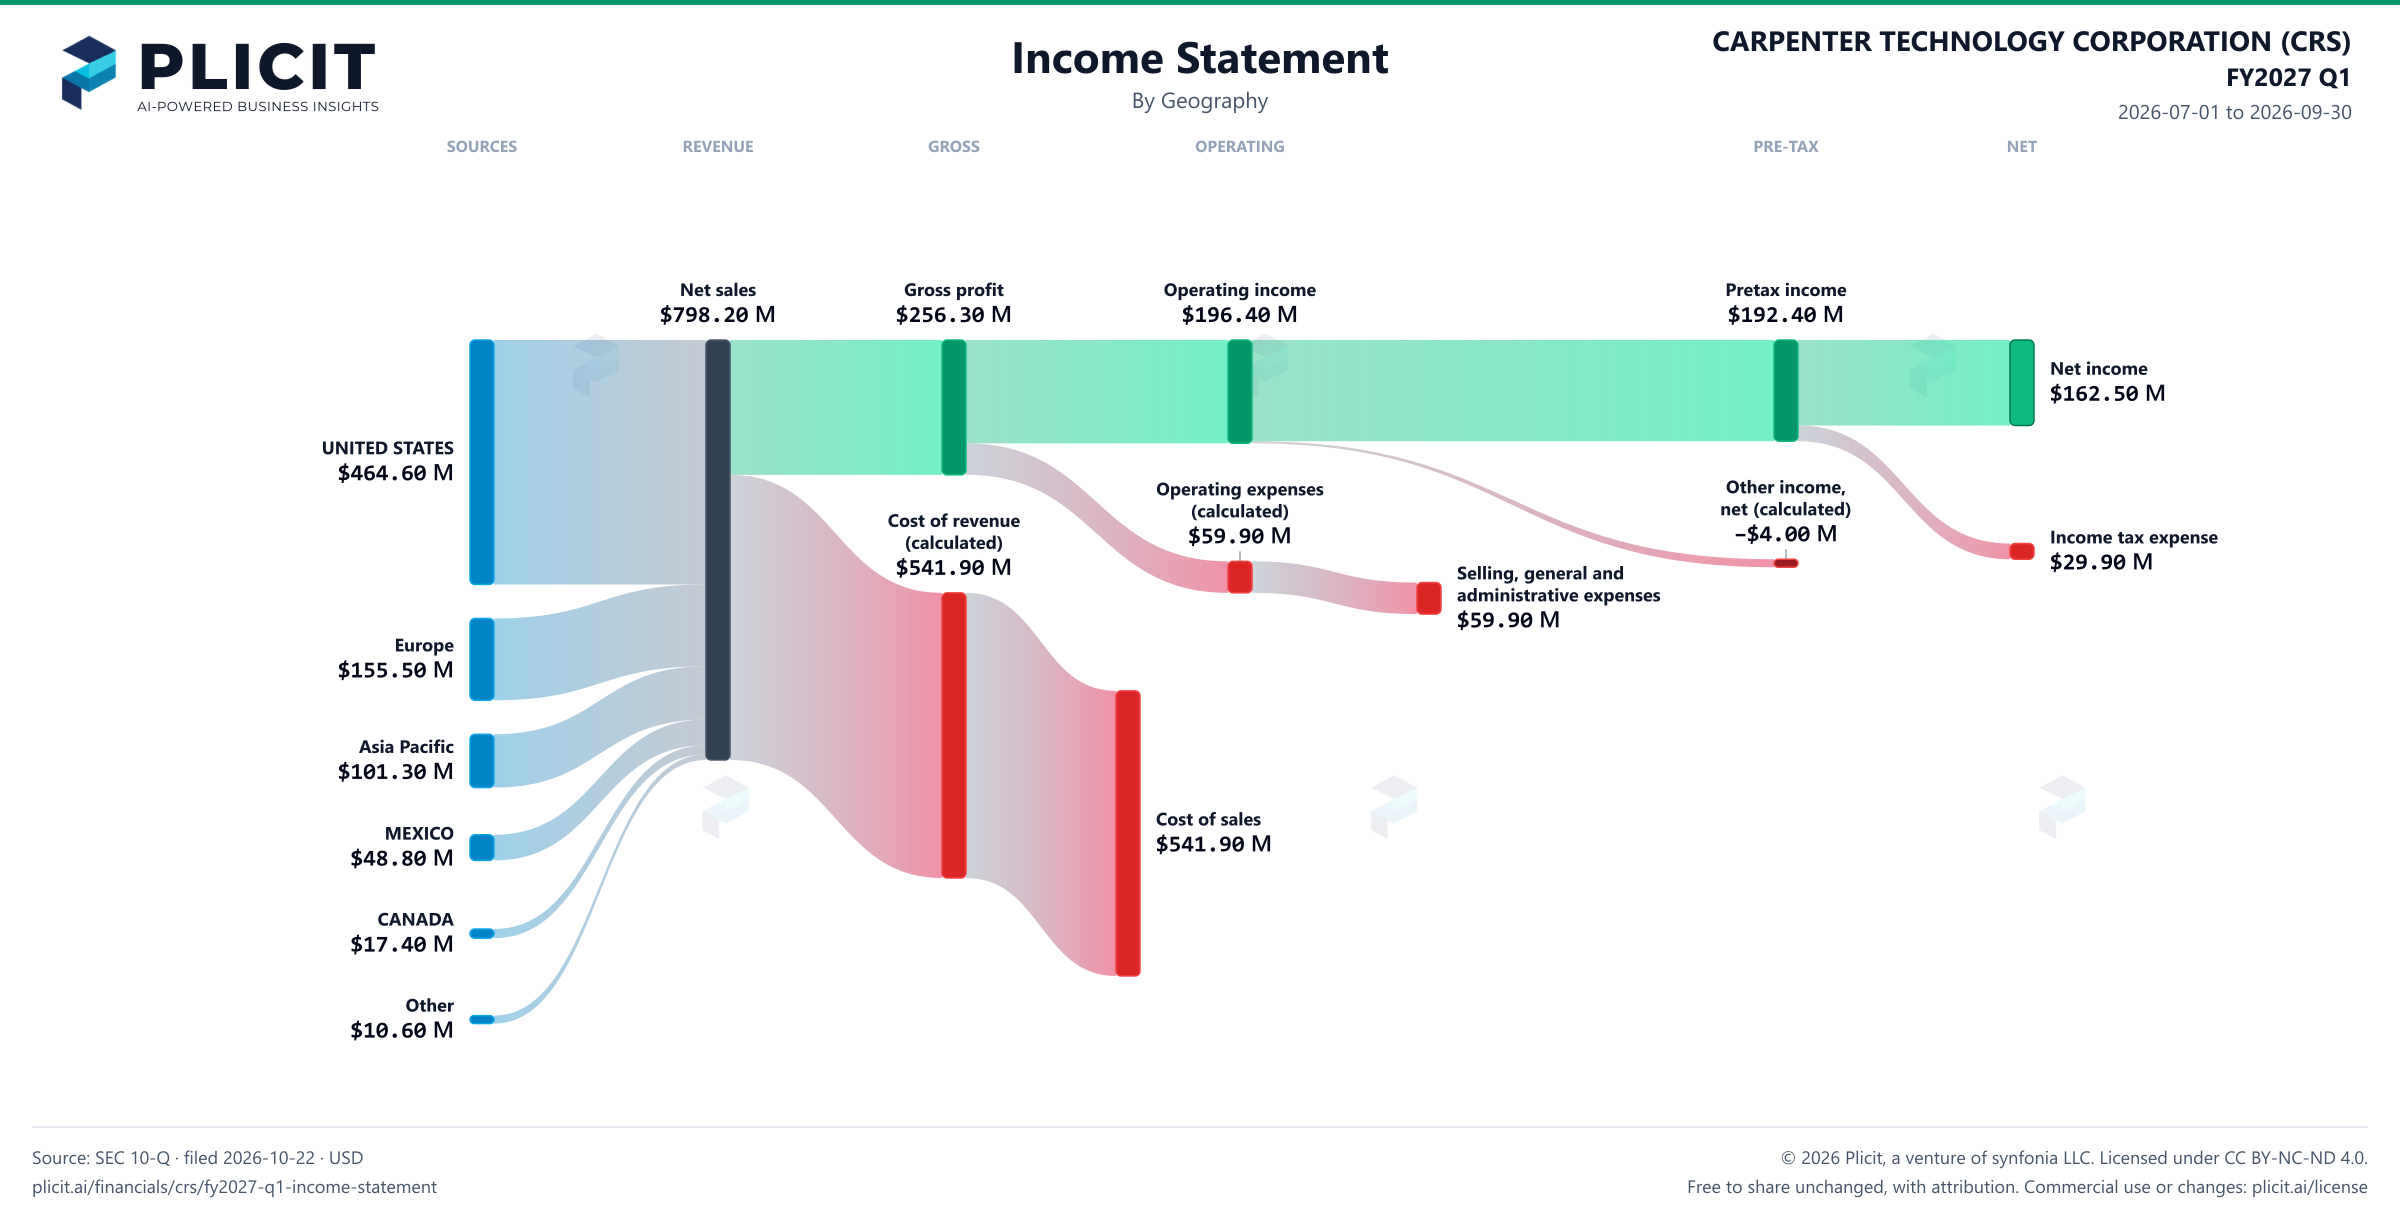
Revenue by Geography

Swipe to see the full flow
CARPENTER TECHNOLOGY CORPORATION (CRS) FY2027 Q1 P&L / Income StatementIncome statement for 2026-07-01 through 2026-09-30. View: Geography. Revenue uses this breakdown; costs and expenses retain the consolidated categories.SOURCESREVENUEGROSSOPERATINGPRE-TAXNETUNITED STATESEuropeAsia PacificMEXICOCANADAOtherNet salesGross profitCost of revenue (calculated)Cost of salesOperating incomeOperating expenses (calculated)Selling, general and administrative expensesIncome before income taxesOther income (expense), net (calculated)Net incomeIncome tax expenseNet salesNet sales$798.20 MGross profitGross profit$256.30 MOperating incomeOperating income$196.40 MIncome before income taxesPretax income$192.40 MNet incomeNet income$162.50 MUNITED STATESUNITED STATES$464.60 MOperating expenses (calculated)Operating expenses(calculated)$59.90 MCost of revenue (calculated)Cost of revenue(calculated)$541.90 MIncome tax expenseIncome tax expense$29.90 MSelling, general and administrative expensesSelling, general andadministrative expenses$59.90 MOther income (expense), net (calculated)Other income,net (calculated)−$4.00 MEuropeEurope$155.50 MAsia PacificAsia Pacific$101.30 MCost of salesCost of sales$541.90 MMEXICOMEXICO$48.80 MCANADACANADA$17.40 MOtherOther$10.60 M
Chart details

CARPENTER TECHNOLOGY CORPORATION (CRS) FY2027 Q1 P&L / Income Statement

Income statement for 2026-07-01 through 2026-09-30. View: Geography. Revenue uses this breakdown; costs and expenses retain the consolidated categories.

Net sales
798,200,000 US dollars
Cost of revenue (calculated)
541,900,000 US dollars
Gross profit
256,300,000 US dollars
Operating expenses (calculated)
59,900,000 US dollars
Operating income
196,400,000 US dollars
Other income (expense), net (calculated)
negative 4,000,000 US dollars
Income before income taxes
192,400,000 US dollars
Income tax expense
29,900,000 US dollars
Net income
162,500,000 US dollars
UNITED STATES
464,600,000 US dollars
Europe
155,500,000 US dollars
Asia Pacific
101,300,000 US dollars
MEXICO
48,800,000 US dollars
CANADA
17,400,000 US dollars
Other
10,600,000 US dollars
Cost of sales
541,900,000 US dollars
Selling, general and administrative expenses
59,900,000 US dollars

Chart connections

  • Revenue less cost of revenue equals gross profit; gross profit less operating expenses equals operating income.
  • Operating income plus other income or expense equals income before tax. Income before tax less income tax expense or benefit equals net income.
CARPENTER TECHNOLOGY CORPORATION (CRS) FY2027 Q1 Revenue by Geography Sankey chart
Free to share unchanged, with credit to Plicit.ai · CC BY-NC-ND 4.0Download PNG

Intelligent Insights for Investors

How much of Carpenter Technology's sales come from outside its home country?

Most of its sales are in the United States, but 42% came from abroad this quarter, against 41% a year earlier. That leaves a large share of revenue exposed to currency and foreign demand.

Which parts of Carpenter Technology's sales by region drove the change over the past year?

The United States added $32.20 M of the $64.50 M rise in revenue from a year earlier, more than any other region. Europe moved the other way, down $10.70 M.

Which part of Carpenter Technology's sales by region grew fastest over the past year?

Mexico grew fastest, by 97% from a year earlier, outpacing the 9% growth of the whole. A region growing faster than the total takes a bigger slice of the mix.

Intelligent Insights for Lenders

Where are Carpenter Technology's factories, offices and other long-term assets located?

The United States holds 100% of Carpenter Technology's long-term assets but brings in 58% of its sales this quarter. Its long-term assets sit at home, so most of the foreign exposure is in sales rather than in plants.

Intelligent Insights for Suppliers

How much does Carpenter Technology depend on the biggest piece of its sales by region?

The United States brought in 58% of these sales this quarter, against 19% for Europe, the next largest. A slowdown at home would hit most of the revenue.

Product waitlist

Health Check and Teardown for your own company

A health check uncovers insights of your private books, not a public ticker. Join this list to get notified as soon as we go-live!