
DEERE & CO (DE) FY2026 Q2 P&L / Income Statement

2026-02-02 to 2026-05-03

Swipe to see the full flow
DEERE & CO (DE) FY2026 Q2 P&L / Income StatementIncome statement for 2026-02-02 through 2026-05-03. View: Segments by Geographical. Revenue uses this breakdown; costs and expenses retain the consolidated categories.SOURCESREVENUE RECONCILIATIONREVENUEGROSSOPERATINGPRE-TAXNETConstruction & Forestry (CF) - UNITED STATESProduction & Precision Agriculture (PPA) - UNITED STATESSmall Agriculture & Turf (SAT) - UNITED STATESFinancial Services (FS)Production & Precision Agriculture (PPA) - Latin AmericaSmall Agriculture & Turf (SAT) - Western EuropeProduction & Precision Agriculture (PPA) - Western EuropeConstruction & Forestry (CF) - Western EuropeProduction & Precision Agriculture (PPA) - CANADASmall Agriculture & Turf (SAT) - Asia, Africa, Oceania, and Middle EastConstruction & Forestry (CF) - Asia, Africa, Oceania, and Middle EastProduction & Precision Agriculture (PPA) - Asia, Africa, Oceania, and Middle EastProduction & Precision Agriculture (PPA) - Central Europe and CISConstruction & Forestry (CF) - Latin AmericaSmall Agriculture & Turf (SAT) - CANADAConstruction & Forestry (CF) - CANADASmall Agriculture & Turf (SAT) - Latin AmericaSmall Agriculture & Turf (SAT) - Central Europe and CISConstruction & Forestry (CF) - Central Europe and CISNet sales and revenuesRevenue before reconciliation (calculated)Components above reported revenue (calculated)Gross profit (calculated)Cost of revenue (calculated)Cost of salesOperating profit (calculated)Operating expenses (calculated)Selling, administrative and general expensesInterest expenseResearch and development expensesOther operating expensesIncome of Consolidated Group before Income TaxesNet IncomeProvision for income taxesEquity in income (loss) of unconsolidated affiliatesRevenue before reconciliation (calculated)Revenue beforereconciliation(calculated)$13.51 BIncome of Consolidated Group before Income TaxesIncome of ConsolidatedGroup beforeIncome Taxes$2.29 BGross profit (calculated)Gross profit(calculated)$5.10 BOperating profit (calculated)Operating profit(calculated)$2.29 BNet sales and revenuesNet sales and revenues$13.37 BConstruction & Forestry (CF) - UNITED STATESConstruction & Forestry(CF) - UNITED STATES$2.32 BNet IncomeNet Income$1.77 BOperating expenses (calculated)Operating expenses(calculated)$2.81 BProduction & Precision Agriculture (PPA) - UNITED STATESProduction & Precision Agriculture(PPA) - UNITED STATES$2.01 BProvision for income taxesProvision forincome taxes$518.00 MSelling, administrative and general expensesSelling, administrativeand general expenses$1.21 BCost of revenue (calculated)Cost of revenue(calculated)$8.27 BSmall Agriculture & Turf (SAT) - UNITED STATESSmall Agriculture & Turf(SAT) - UNITED STATES$1.83 BInterest expenseInterest expense$712.00 MEquity in income (loss) of unconsolidated affiliatesEquity in income(loss) ofunconsolidated…−$5.00 MFinancial Services (FS)Financial Services (FS)$1.51 BResearch and development expensesResearch anddevelopment expenses$583.00 MProduction & Precision Agriculture (PPA) - Latin AmericaProduction & PrecisionAgriculture (PPA) - Latin America$828.00 MCost of salesCost of sales$8.27 BOther operating expensesOther operating expenses$306.00 MSmall Agriculture & Turf (SAT) - Western EuropeSmall Agriculture & Turf(SAT) - Western Europe$827.00 MComponents above reported revenue (calculated)Components abovereported revenue(calculated)−$143.00 MProduction & Precision Agriculture (PPA) - Western EuropeProduction & Precision Agriculture(PPA) - Western Europe$654.00 MConstruction & Forestry (CF) - Western EuropeConstruction & Forestry(CF) - Western Europe$608.00 MProduction & Precision Agriculture (PPA) - CANADAProduction & PrecisionAgriculture (PPA) - CANADA$487.00 MSmall Agriculture & Turf (SAT) - Asia, Africa, Oceania, and Middle EastSmall Agriculture & Turf (SAT) - Asia,Africa, Oceania, and Middle East$446.00 MConstruction & Forestry (CF) - Asia, Africa, Oceania, and Middle EastConstruction & Forestry (CF) - Asia,Africa, Oceania, and Middle East$369.00 MProduction & Precision Agriculture (PPA) - Asia, Africa, Oceania, and Middle EastProduction & PrecisionAgriculture (PPA) - Asia, Africa,Oceania, and Middle East$329.00 MProduction & Precision Agriculture (PPA) - Central Europe and CISProduction & Precision Agriculture(PPA) - Central Europe and CIS$297.00 MConstruction & Forestry (CF) - Latin AmericaConstruction & Forestry(CF) - Latin America$280.00 MSmall Agriculture & Turf (SAT) - CANADASmall Agriculture &Turf (SAT) - CANADA$187.00 MConstruction & Forestry (CF) - CANADAConstruction & Forestry(CF) - CANADA$175.00 MSmall Agriculture & Turf (SAT) - Latin AmericaSmall Agriculture & Turf(SAT) - Latin America$128.00 MSmall Agriculture & Turf (SAT) - Central Europe and CISSmall Agriculture & Turf (SAT)- Central Europe and CIS$121.00 MConstruction & Forestry (CF) - Central Europe and CISConstruction & Forestry (CF)- Central Europe and CIS$105.00 M
Chart details

DEERE & CO (DE) FY2026 Q2 P&L / Income Statement

Income statement for 2026-02-02 through 2026-05-03. View: Segments by Geographical. Revenue uses this breakdown; costs and expenses retain the consolidated categories.

Net sales and revenues
13,369,000,000 US dollars
Cost of revenue (calculated)
8,266,000,000 US dollars
Gross profit (calculated)
5,103,000,000 US dollars
Operating expenses (calculated)
2,810,000,000 US dollars
Operating profit (calculated)
2,293,000,000 US dollars
Other income (expense), net (calculated)
0 US dollars
Income of Consolidated Group before Income Taxes
2,293,000,000 US dollars
Provision for income taxes
518,000,000 US dollars
Net Income
1,770,000,000 US dollars
Financial Services (FS)
1,509,000,000 US dollars
Construction & Forestry (CF) - CANADA
175,000,000 US dollars
Construction & Forestry (CF) - UNITED STATES
2,317,000,000 US dollars
Construction & Forestry (CF) - Asia, Africa, Oceania, and Middle East
369,000,000 US dollars
Construction & Forestry (CF) - Central Europe and CIS
105,000,000 US dollars
Construction & Forestry (CF) - Western Europe
608,000,000 US dollars
Construction & Forestry (CF) - Latin America
280,000,000 US dollars
Production & Precision Agriculture (PPA) - CANADA
487,000,000 US dollars
Production & Precision Agriculture (PPA) - UNITED STATES
2,012,000,000 US dollars
Production & Precision Agriculture (PPA) - Asia, Africa, Oceania, and Middle East
329,000,000 US dollars
Production & Precision Agriculture (PPA) - Central Europe and CIS
297,000,000 US dollars
Production & Precision Agriculture (PPA) - Western Europe
654,000,000 US dollars
Production & Precision Agriculture (PPA) - Latin America
828,000,000 US dollars
Small Agriculture & Turf (SAT) - CANADA
187,000,000 US dollars
Small Agriculture & Turf (SAT) - UNITED STATES
1,833,000,000 US dollars
Small Agriculture & Turf (SAT) - Asia, Africa, Oceania, and Middle East
446,000,000 US dollars
Small Agriculture & Turf (SAT) - Central Europe and CIS
121,000,000 US dollars
Small Agriculture & Turf (SAT) - Western Europe
827,000,000 US dollars
Small Agriculture & Turf (SAT) - Latin America
128,000,000 US dollars
Cost of sales
8,266,000,000 US dollars
Research and development expenses
583,000,000 US dollars
Selling, administrative and general expenses
1,209,000,000 US dollars
Interest expense
712,000,000 US dollars
Other operating expenses
306,000,000 US dollars
Revenue before reconciliation (calculated)
13,512,000,000 US dollars. Sum of the reported revenue categories before the separately reported reconciliation.
Components above reported revenue (calculated)
negative 143,000,000 US dollars. The disclosed components add up to more than reported revenue; this is the difference, calculated, not a reported item.
Equity in income (loss) of unconsolidated affiliates
negative 5,000,000 US dollars. Reported below-tax contribution to net income.

Chart connections

  • Revenue less cost of revenue equals gross profit; gross profit less operating expenses equals operating income.
  • Operating income plus other income or expense equals income before tax. Income before tax less income tax expense or benefit, plus the explicitly reported below-tax contributions, equals net income.
  • Reported revenue categories plus the separately reported signed reconciliation equals consolidated revenue.
  • Of which attributable to DEERE & CO: $1.77 B; to noncontrolling interests: −$3.00 M.
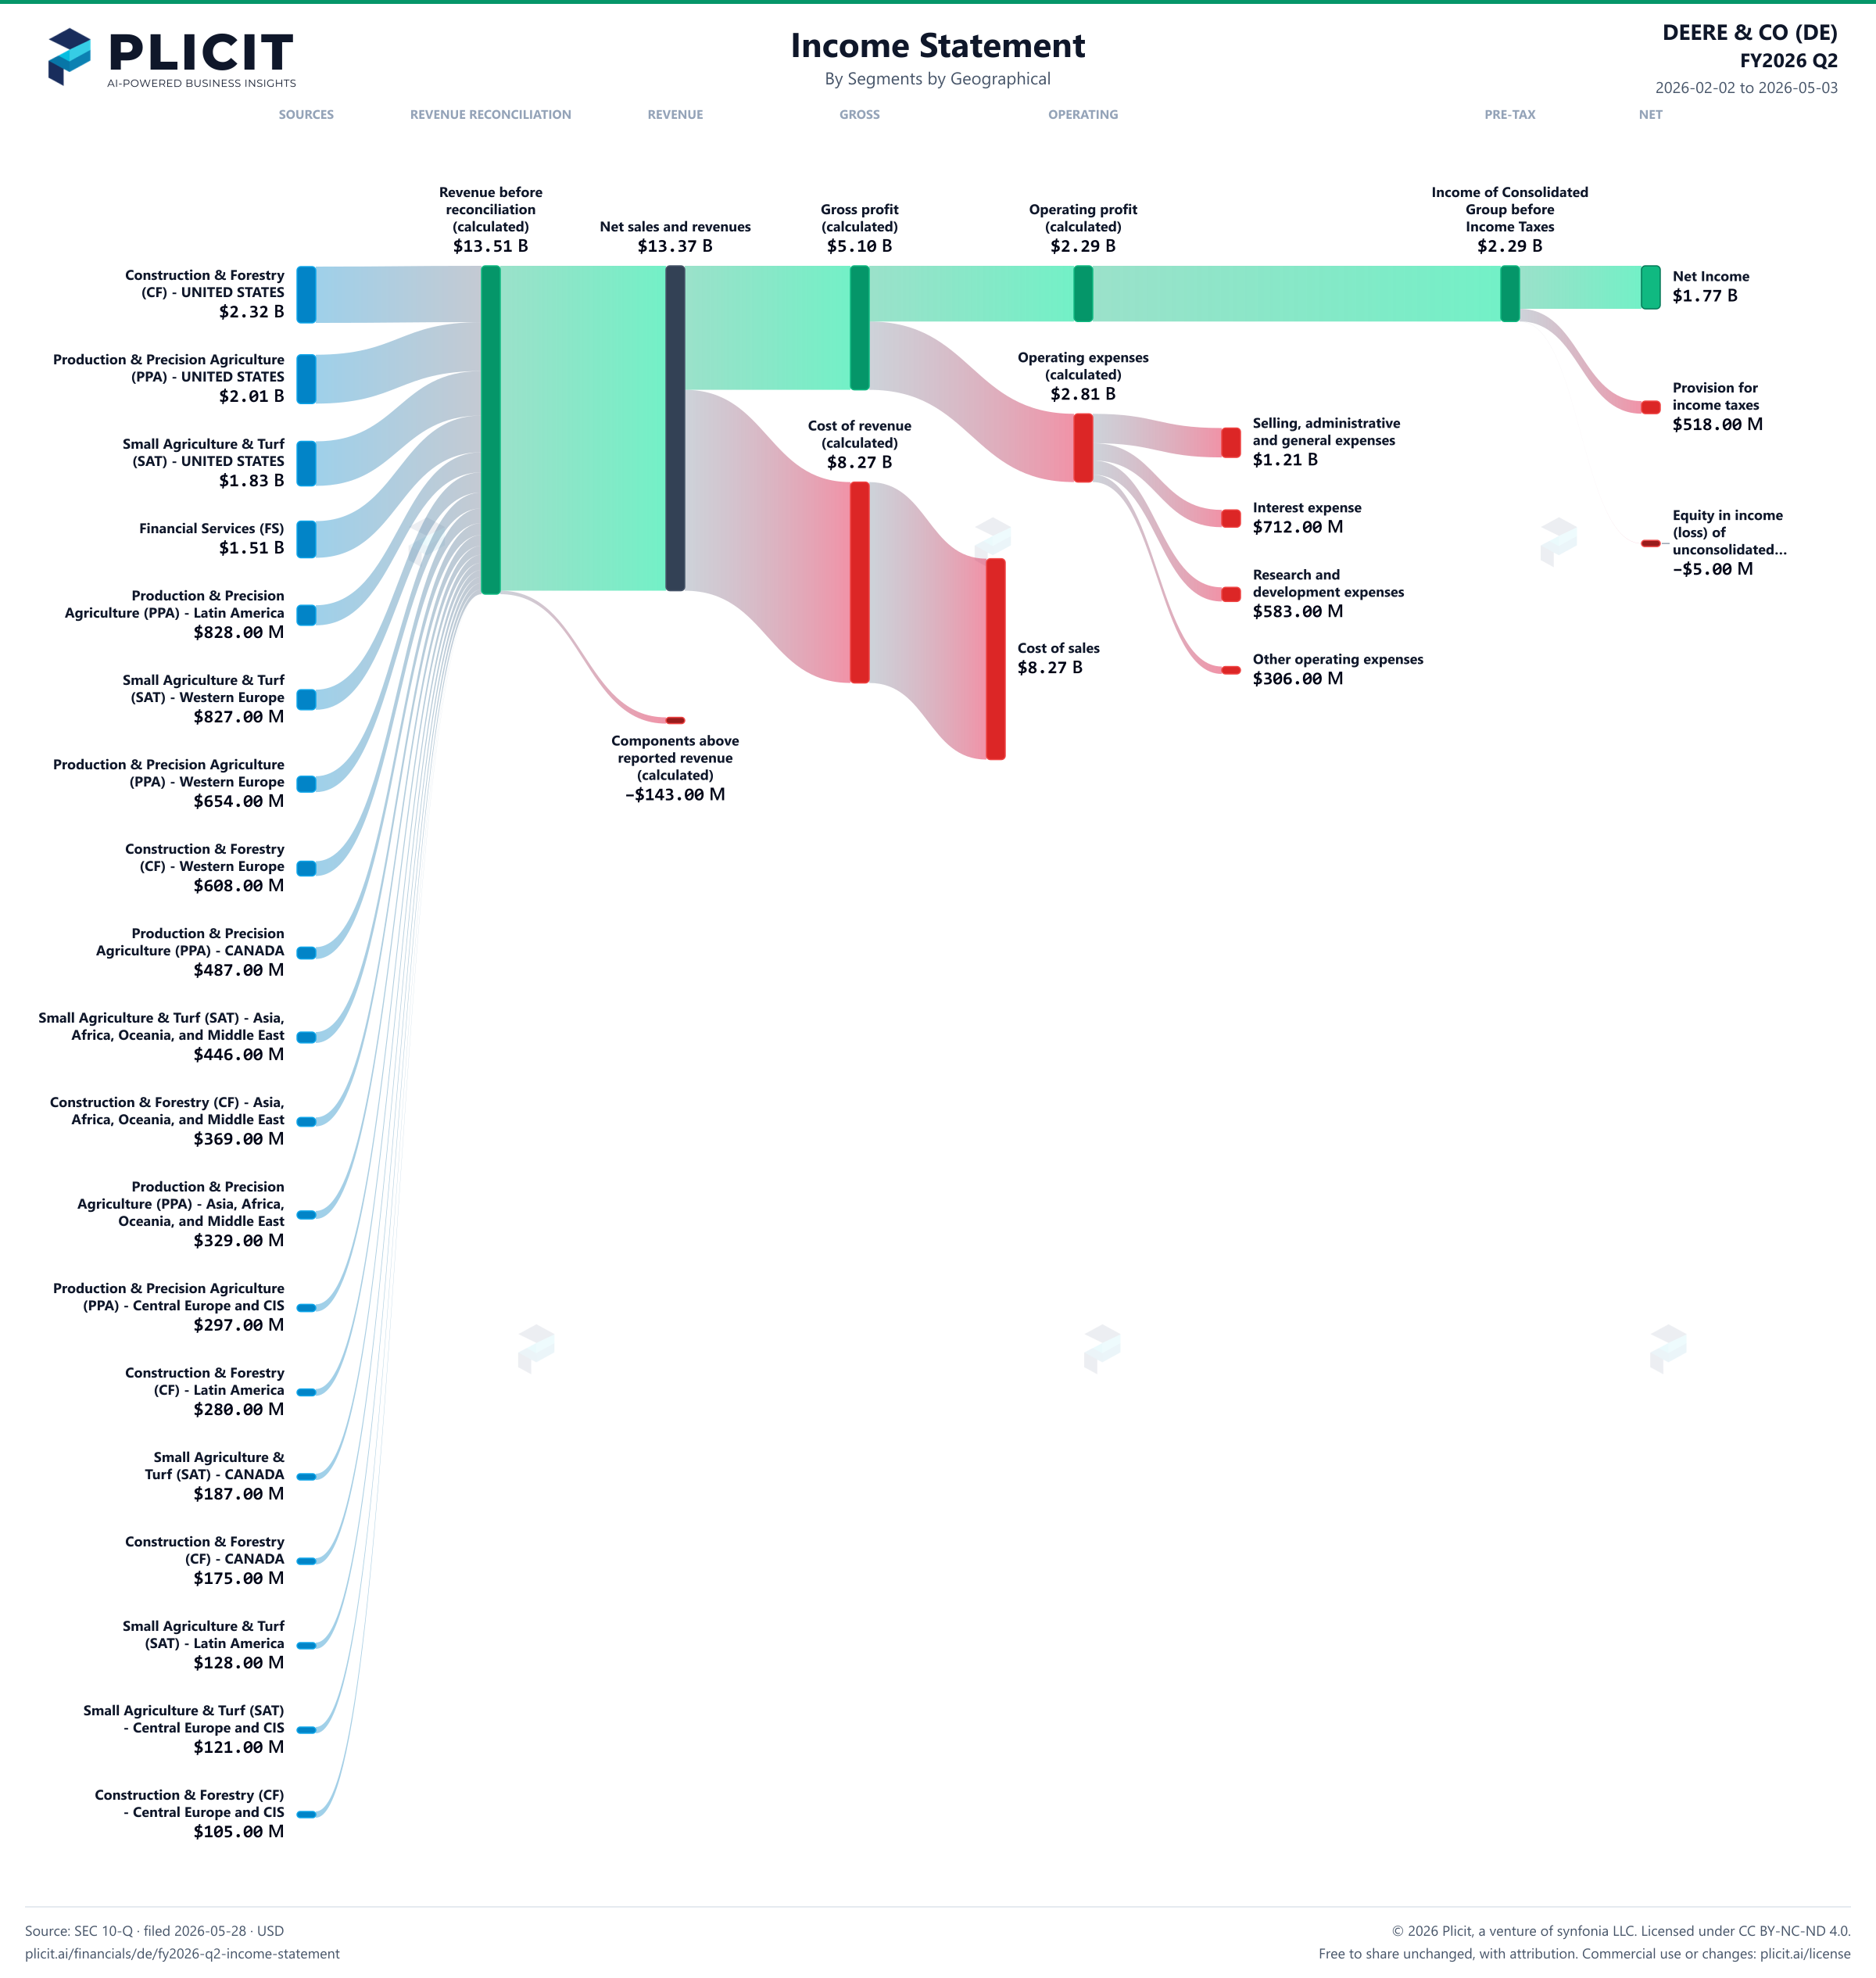
DEERE & CO (DE) FY2026 Q2 Revenue by Business Segment by Geography Sankey chart
Free to share unchanged, with credit to Plicit.ai · CC BY-NC-ND 4.0Download PNG

Gross margin

38.2%

Gross profit / revenue

Operating margin

17.2%

Operating profit / revenue

Cash conversion

109.2%

Operating cash / net income, same period

Newsletter

Get the teardowns by email

Subscribe if you want the public-company teardowns in your inbox when they're released.

Product waitlist

Health Check and Teardown for your own company

A health check uncovers insights of your private books, not a public ticker. Join this list to get notified as soon as we go-live!