
BRINKER INTERNATIONAL, INC. (EAT) FY2027 Q1 P&L / Income Statement

Published · Updated Source: Form 10-Q on SEC EDGAR filed (opens in a new tab)

Key Takeaways

  • Chili's operating income of $205.00 M beat the whole company's $151.00 M.
  • Maggiano's lost $3.60 M, and the Corporate segment lost $50.40 M on operating income.
  • Chili's labor cost of $423.40 M was its largest cost, at 31% of its sales.
  • Chili's added $36.00 M of operating income, while the Corporate loss grew by $3.40 M.

The Unvarnished Truth

Chili's brings in 94% of sales and out-earns the whole company

Chili's brought in $1.38 B of Brinker's $1.48 B in revenue this quarter, and it kept more operating profit than the company as a whole. Its operating income was $205.00 M, while Maggiano's lost $3.60 M and the Corporate segment lost $50.40 M. The company total of $151.00 M is smaller than Chili's alone, and that is the arithmetic behind the headline. Chili's kept 15% of its sales as operating income, against a loss equal to 3.8% of sales at Maggiano's. Its revenue rose 10.5% from a year earlier, while Maggiano's revenue fell 4.6%.

Management credits Chili's growth to higher traffic and menu pricing, and puts Maggiano's decline down to lower traffic. The traffic numbers are the test: Chili's comparable sales rose 10.1%, of which traffic supplied 6.4% and price 3.7%. Maggiano's comparable sales fell 3.4%, with traffic down 5.1%. Head-office costs rose too: the Corporate segment lost $50.40 M, against $47.00 M a year earlier. Its unallocated costs cover information technology, human capital management, accounting, legal, purchasing and restaurant development.

For a reader, the lesson is that Brinker's profit is a Chili's story with a head-office drag attached. A reader who looks only at the company total of $151.00 M would miss how much the restaurants are carrying. Per dollar of assets, Chili's brought in $0.61 of revenue, against $0.32 at Maggiano's. Watch Maggiano's: it carries $297.00 M of assets against sales that fell, and that is where a turnaround would have to show. Is the head office growing faster than the restaurants that pay for it?
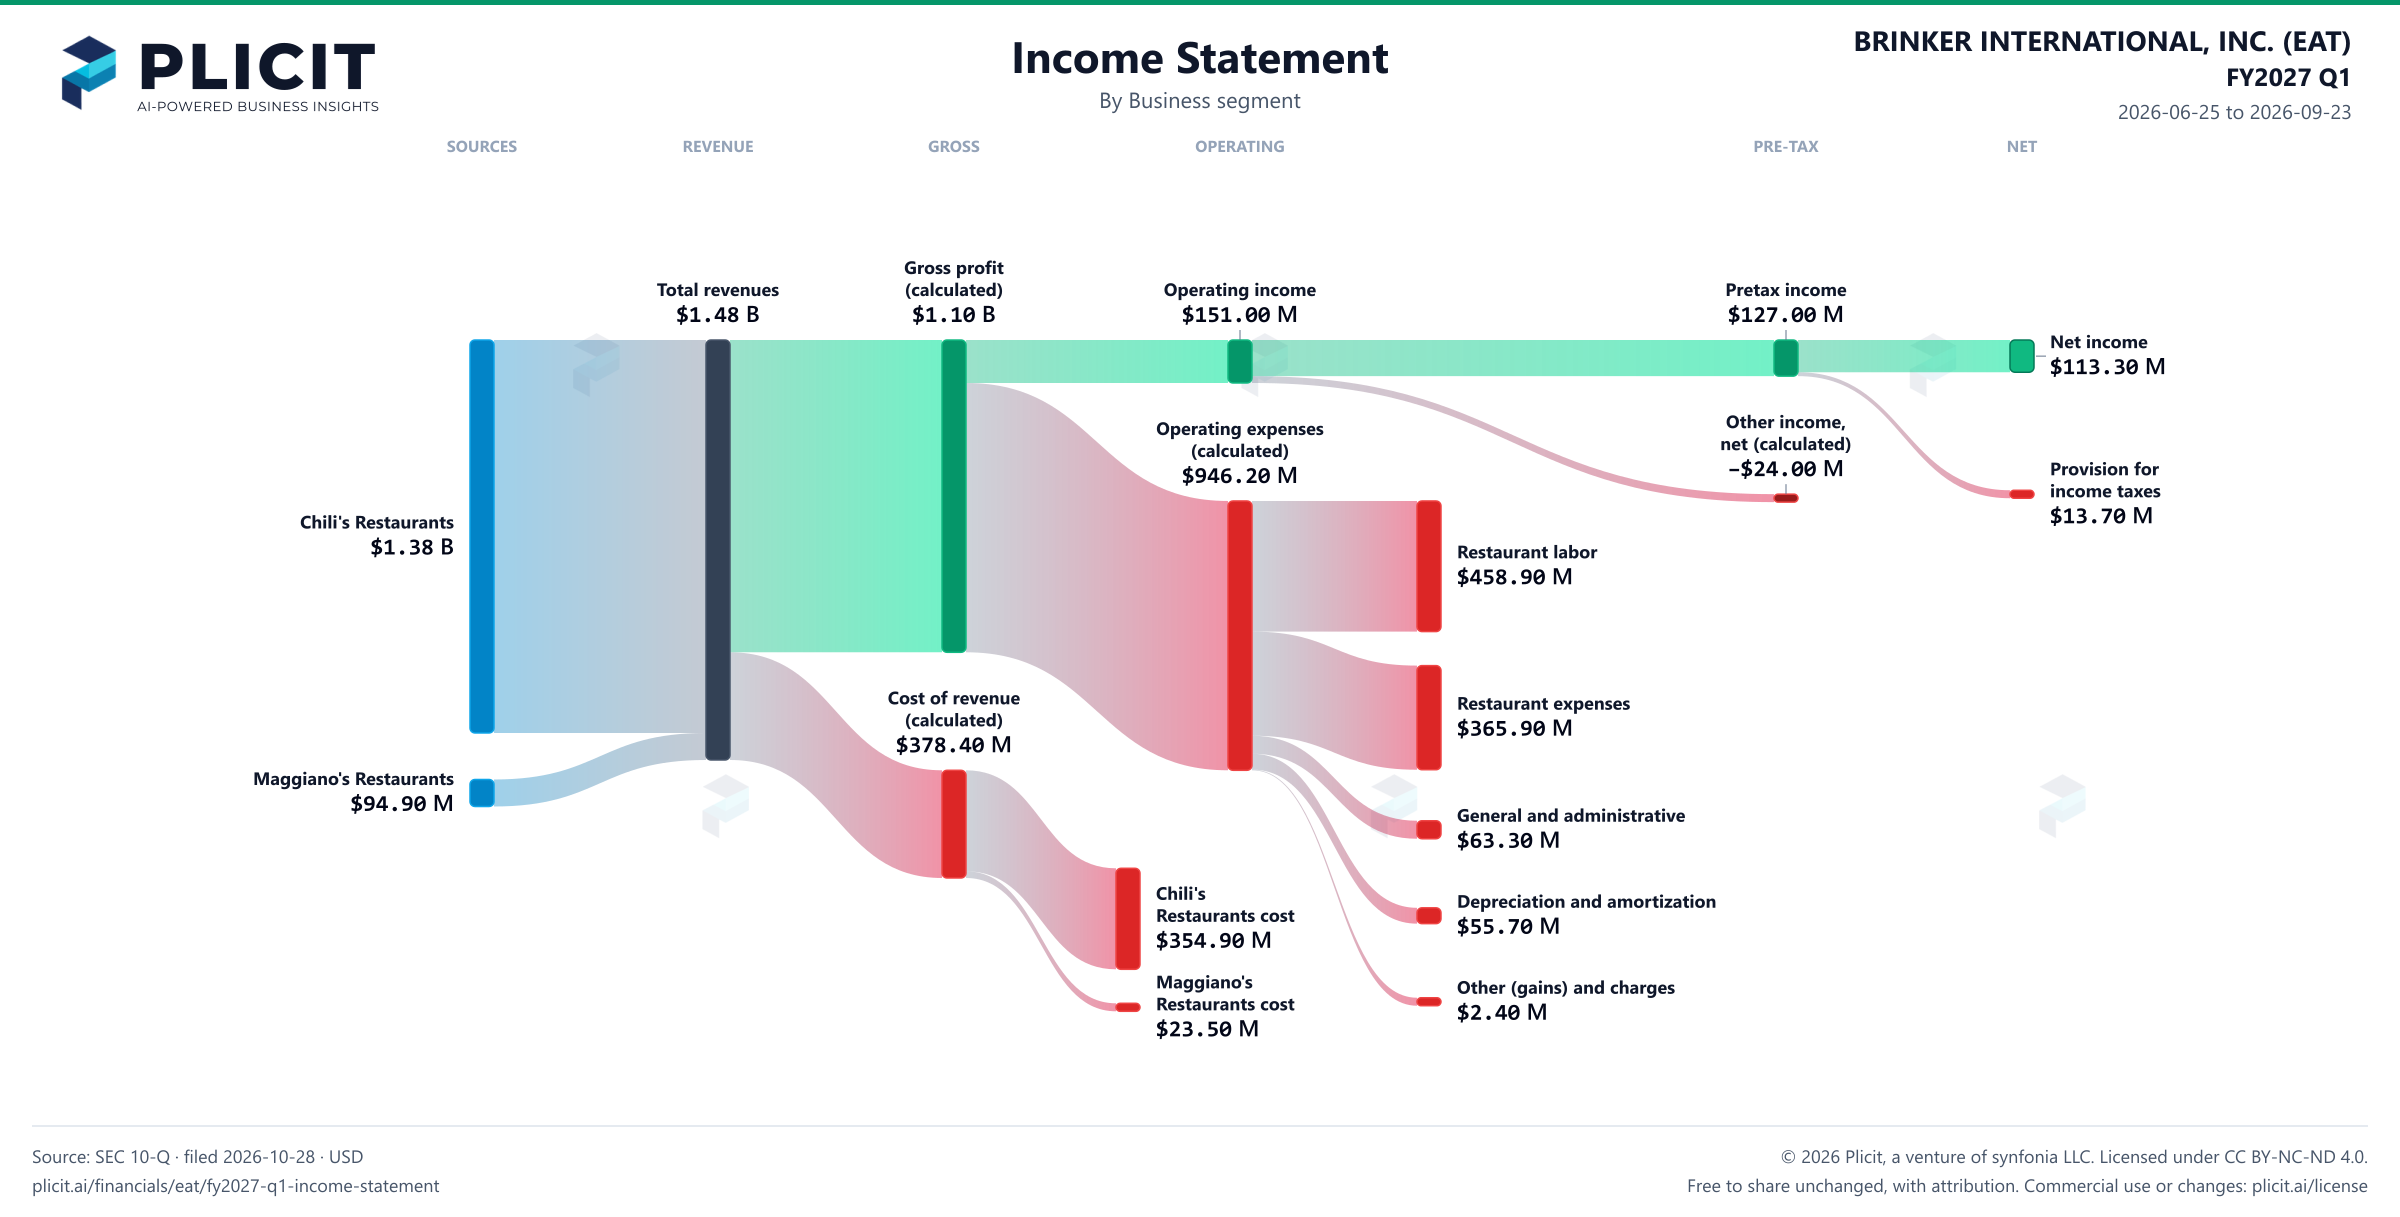
Revenue by Business Segment

Swipe to see the full flow
BRINKER INTERNATIONAL, INC. (EAT) FY2027 Q1 P&L / Income StatementIncome statement for 2026-06-25 through 2026-09-23. View: Business segment. Revenue and costs use their disclosed categories.SOURCESREVENUEGROSSOPERATINGPRE-TAXNETChili's Restaurants revenueMaggiano's Restaurants revenueTotal revenuesGross profit (calculated)Cost of revenue (calculated)Chili's Restaurants cost of revenueMaggiano's Restaurants cost of revenueOperating incomeOperating expenses (calculated)Restaurant laborRestaurant expensesGeneral and administrativeDepreciation and amortizationOther (gains) and chargesIncome before income taxesOther income (expense), net (calculated)Net incomeProvision for income taxesGross profit (calculated)Gross profit(calculated)$1.10 BTotal revenuesTotal revenues$1.48 BOperating incomeOperating income$151.00 MIncome before income taxesPretax income$127.00 MNet incomeNet income$113.30 MOperating expenses (calculated)Operating expenses(calculated)$946.20 MProvision for income taxesProvision forincome taxes$13.70 MChili's Restaurants revenueChili's Restaurants$1.38 BOther income (expense), net (calculated)Other income,net (calculated)−$24.00 MRestaurant laborRestaurant labor$458.90 MCost of revenue (calculated)Cost of revenue(calculated)$378.40 MRestaurant expensesRestaurant expenses$365.90 MMaggiano's Restaurants revenueMaggiano's Restaurants$94.90 MGeneral and administrativeGeneral and administrative$63.30 MChili's Restaurants cost of revenueChili'sRestaurants cost$354.90 MDepreciation and amortizationDepreciation and amortization$55.70 MMaggiano's Restaurants cost of revenueMaggiano'sRestaurants cost$23.50 MOther (gains) and chargesOther (gains) and charges$2.40 M
Chart details

BRINKER INTERNATIONAL, INC. (EAT) FY2027 Q1 P&L / Income Statement

Income statement for 2026-06-25 through 2026-09-23. View: Business segment. Revenue and costs use their disclosed categories.

Total revenues
1,475,600,000 US dollars
Cost of revenue (calculated)
378,400,000 US dollars
Gross profit (calculated)
1,097,200,000 US dollars
Operating expenses (calculated)
946,200,000 US dollars
Operating income
151,000,000 US dollars
Other income (expense), net (calculated)
negative 24,000,000 US dollars
Income before income taxes
127,000,000 US dollars
Provision for income taxes
13,700,000 US dollars
Net income
113,300,000 US dollars
Chili's Restaurants revenue
1,380,700,000 US dollars
Maggiano's Restaurants revenue
94,900,000 US dollars
Corporate Segment and Other Operating Segment revenue
0 US dollars
Chili's Restaurants cost of revenue
354,900,000 US dollars
Maggiano's Restaurants cost of revenue
23,500,000 US dollars
Corporate Segment and Other Operating Segment cost of revenue
0 US dollars
Restaurant labor
458,900,000 US dollars
Restaurant expenses
365,900,000 US dollars
Depreciation and amortization
55,700,000 US dollars
General and administrative
63,300,000 US dollars
Other (gains) and charges
2,400,000 US dollars

Chart connections

  • Revenue less cost of revenue equals gross profit; gross profit less operating expenses equals operating income.
  • Operating income plus other income or expense equals income before tax. Income before tax less income tax expense or benefit equals net income.
BRINKER INTERNATIONAL, INC. (EAT) FY2027 Q1 Revenue by Business Segment Sankey chart
Free to share unchanged, with credit to Plicit.ai · CC BY-NC-ND 4.0Download PNG

Intelligent Insights for Investors

Which of Brinker's businesses brings in the most sales?

It's Chili's, and it isn't close: $1.38 B of the $1.48 B total this quarter. Maggiano's brought in $94.90 M, a distant second.

How profitable is each of Brinker's businesses?

Chili's is the most profitable: it kept 15% of its sales as operating income this quarter, against a loss equal to 3.8% of sales at Maggiano's. Chili's kept $205.00 M of operating income on $1.38 B of sales, and Maggiano's lost $3.60 M on $94.90 M.

Which of Brinker's businesses drove its profit change over the past year?

All of the gain, and then some, came from Chili's, which added $36.00 M of operating income this quarter. The Corporate segment's loss grew by $3.40 M, trimming the combined rise.

How much do head-office costs take out of Brinker's business profits?

Head-office costs are not added on top: the Corporate segment already carries them, and the three segments add up to the company's total, $151.00 M this quarter. That loss equals 25% of Chili's $205.00 M of operating income.

Intelligent Insights for Lenders

Which of Brinker's businesses earns the highest return on its assets?

Chili's is the highest: its operating income this quarter came to 9.1% of its assets, against -22% at the Corporate segment. The Corporate segment holds $228.00 M of assets and earns a loss on them.

Intelligent Insights for Suppliers

What does it cost Brinker to make or deliver what it sells?

Cost of sales took 26% of Brinker's sales this quarter. Chili's made up 94% of that cost, or $354.90 M of the $378.40 M total.

Product waitlist

Health Check and Teardown for your own company

A health check uncovers insights of your private books, not a public ticker. Join this list to get notified as soon as we go-live!