
BRINKER INTERNATIONAL, INC. (EAT) FY2027 Q1 P&L / Income Statement

Published · Updated Source: Form 10-Q on SEC EDGAR filed (opens in a new tab)

Key Takeaways

  • Company sales of $1.37 B made up 99% of Chili's revenue in the quarter just ended.
  • Franchise revenues were $14.20 M, or 4.8% of the $296.7 M that franchisees sold.
  • Chili's company sales supplied $130.30 M of its $131.00 M revenue gain.
  • Maggiano's company sales fell $4.50 M, the biggest drop among the parts.

The Unvarnished Truth

Chili's sales are 99% company restaurants, not franchise royalties

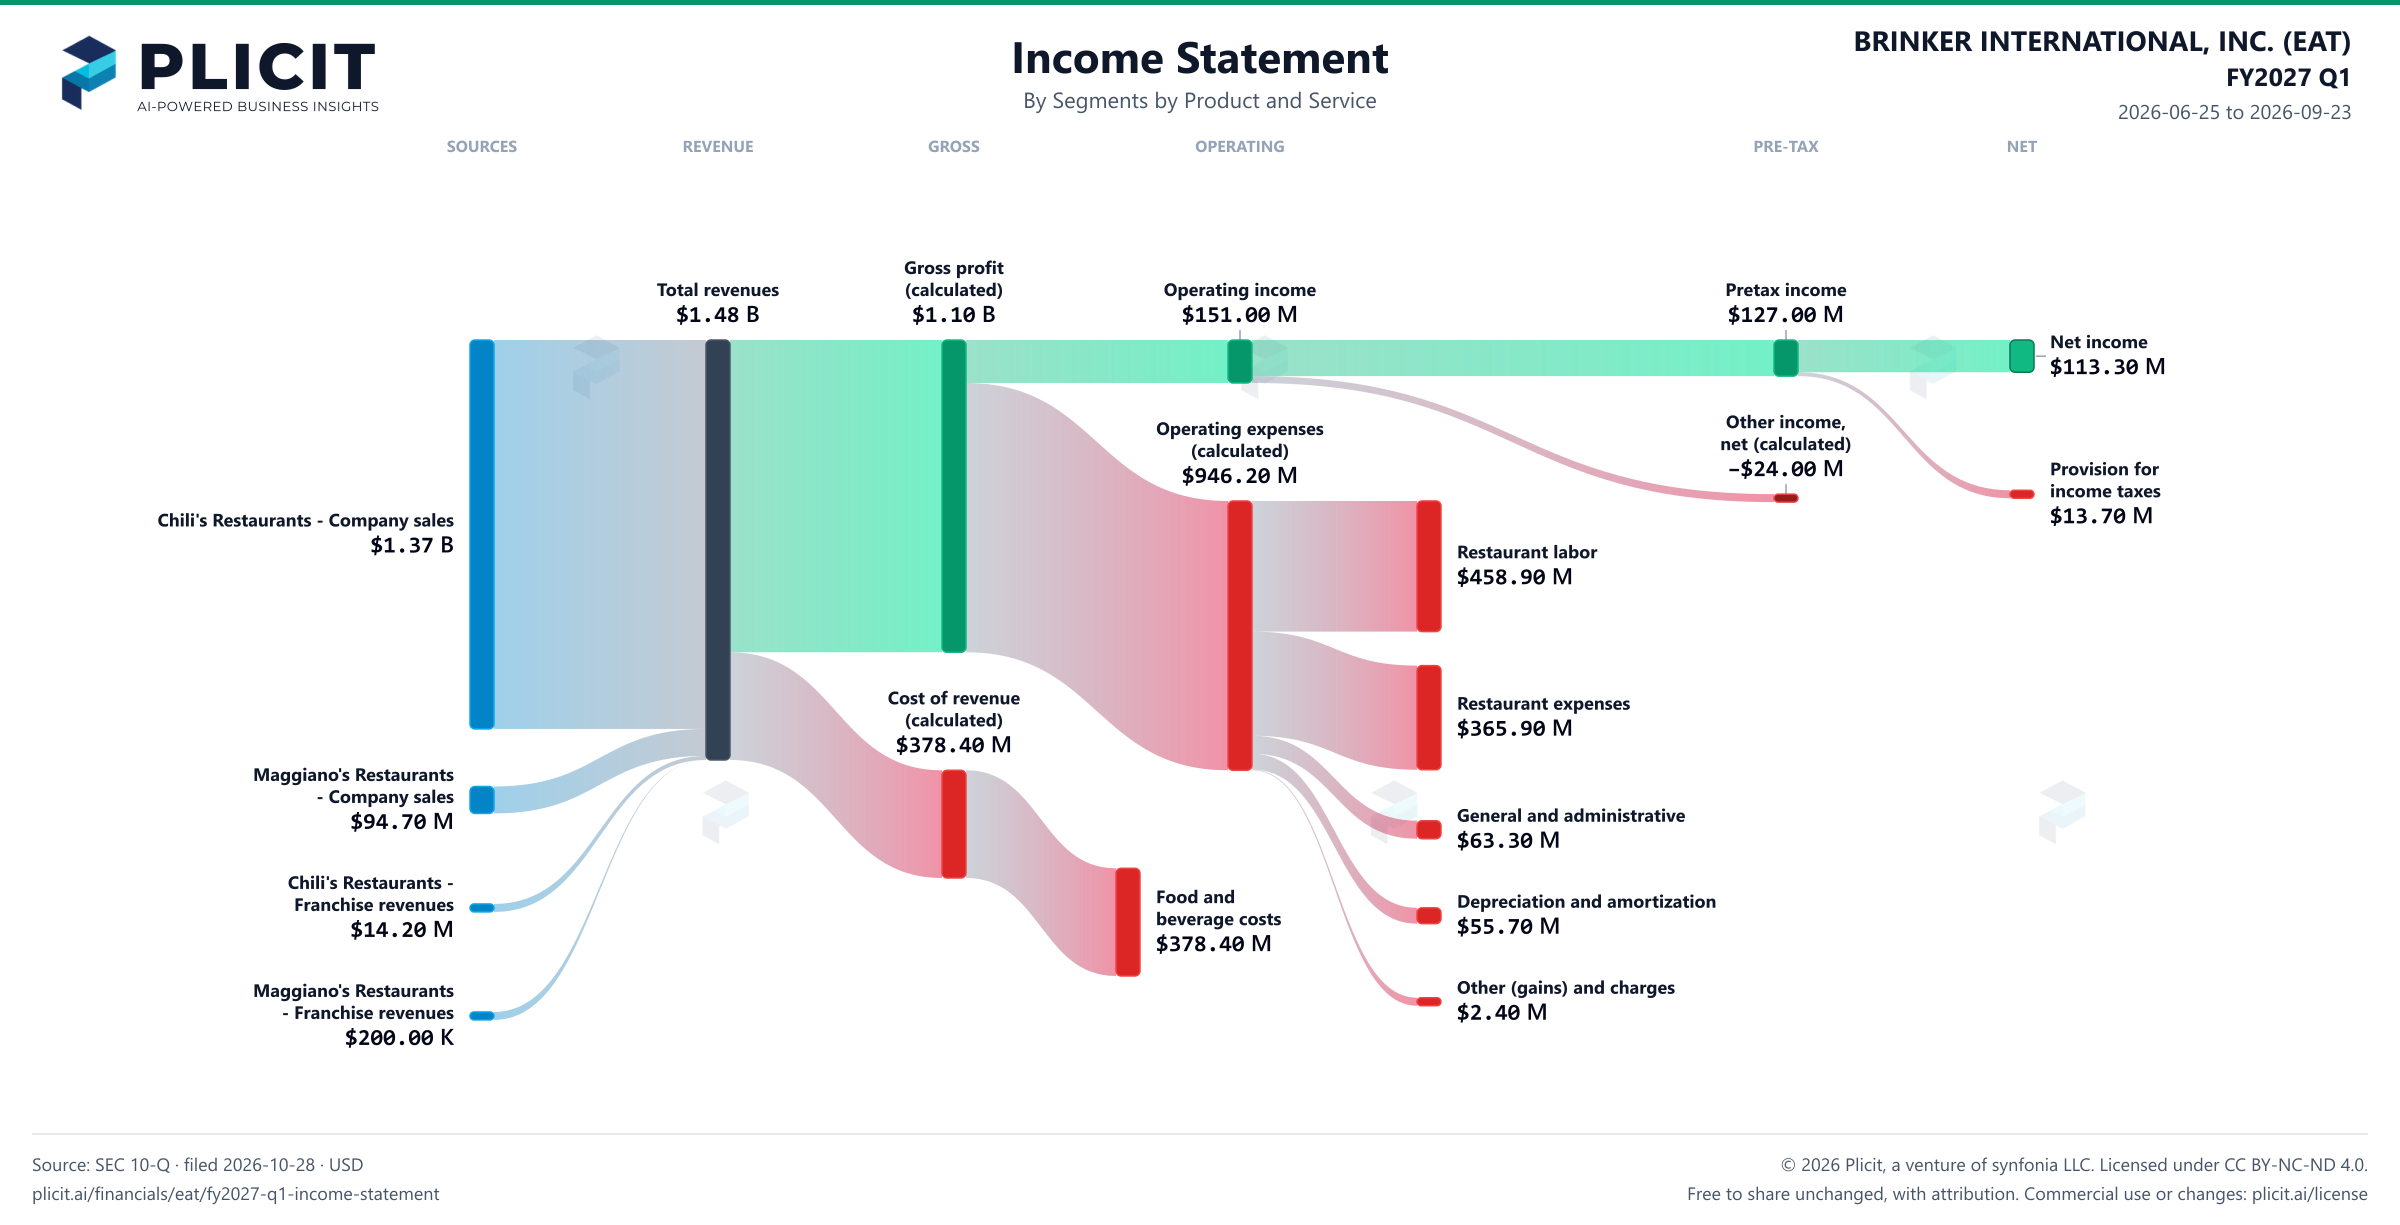
Chili's sales are almost entirely its own restaurants, not franchise income. Company sales were $1.37 B of its $1.38 B total, and franchise revenues were $14.20 M. Those restaurants carry their own rent, labor and supplies, so the cost of running them stays with Brinker. Maggiano's company sales shrank, while Chili's company sales grew 11% from a year earlier. The next question is whether company sales can keep growing without more restaurants. Chili's bought 12 restaurants from a former franchisee this quarter, and their sales are inside its company line.

Franchise revenues were $14.20 M, or 4.8% of the $296.7 M that Chili's franchisees sold. That is not a royalty rate, because franchise revenues also include advertising fees, franchise and development fees, and other service fees. Management credits Chili's revenue growth to higher traffic and menu pricing. The acquisition itself added $2.4 M, while comparable Chili's restaurants added $123.3 M to revenue. The gain came mostly from restaurants that were already open.

This view says the restaurants themselves are the story, and the franchise model is a side business. Maggiano's company sales were $94.70 M, down $4.50 M from a year earlier. Maggiano's franchise line also shrank, from $0.30 M to $0.20 M. Watch whether company sales keep growing once the acquisition effect ends. A view of the restaurants alone cannot tell a reader whether guests are returning. Is Chili's company-sales growth coming from more guests or from higher prices?
2026-06-25 to 2026-09-23

Revenue by Business Segment by Product and Service

Swipe to see the full flow
BRINKER INTERNATIONAL, INC. (EAT) FY2027 Q1 P&L / Income StatementIncome statement for 2026-06-25 through 2026-09-23. View: Segments by Product and Service. Revenue uses this breakdown; costs and expenses retain the consolidated categories.SOURCESREVENUEGROSSOPERATINGPRE-TAXNETChili's Restaurants - Company salesMaggiano's Restaurants - Company salesChili's Restaurants - Franchise revenuesMaggiano's Restaurants - Franchise revenuesTotal revenuesGross profit (calculated)Cost of revenue (calculated)Food and beverage costsOperating incomeOperating expenses (calculated)Restaurant laborRestaurant expensesGeneral and administrativeDepreciation and amortizationOther (gains) and chargesIncome before income taxesOther income (expense), net (calculated)Net incomeProvision for income taxesGross profit (calculated)Gross profit(calculated)$1.10 BTotal revenuesTotal revenues$1.48 BOperating incomeOperating income$151.00 MIncome before income taxesPretax income$127.00 MNet incomeNet income$113.30 MOperating expenses (calculated)Operating expenses(calculated)$946.20 MProvision for income taxesProvision forincome taxes$13.70 MChili's Restaurants - Company salesChili's Restaurants - Company sales$1.37 BOther income (expense), net (calculated)Other income,net (calculated)−$24.00 MRestaurant laborRestaurant labor$458.90 MCost of revenue (calculated)Cost of revenue(calculated)$378.40 MRestaurant expensesRestaurant expenses$365.90 MMaggiano's Restaurants - Company salesMaggiano's Restaurants- Company sales$94.70 MGeneral and administrativeGeneral and administrative$63.30 MChili's Restaurants - Franchise revenuesChili's Restaurants -Franchise revenues$14.20 MFood and beverage costsFood andbeverage costs$378.40 MDepreciation and amortizationDepreciation and amortization$55.70 MOther (gains) and chargesOther (gains) and charges$2.40 MMaggiano's Restaurants - Franchise revenuesMaggiano's Restaurants- Franchise revenues$200.00 K
Chart details

BRINKER INTERNATIONAL, INC. (EAT) FY2027 Q1 P&L / Income Statement

Income statement for 2026-06-25 through 2026-09-23. View: Segments by Product and Service. Revenue uses this breakdown; costs and expenses retain the consolidated categories.

Total revenues
1,475,600,000 US dollars
Cost of revenue (calculated)
378,400,000 US dollars
Gross profit (calculated)
1,097,200,000 US dollars
Operating expenses (calculated)
946,200,000 US dollars
Operating income
151,000,000 US dollars
Other income (expense), net (calculated)
negative 24,000,000 US dollars
Income before income taxes
127,000,000 US dollars
Provision for income taxes
13,700,000 US dollars
Net income
113,300,000 US dollars
Chili's Restaurants - Company sales
1,366,500,000 US dollars
Chili's Restaurants - Franchise revenues
14,200,000 US dollars
Maggiano's Restaurants - Company sales
94,700,000 US dollars
Maggiano's Restaurants - Franchise revenues
200,000 US dollars
Corporate Segment and Other Operating Segment - Company sales
0 US dollars
Corporate Segment and Other Operating Segment - Franchise revenues
0 US dollars
Food and beverage costs
378,400,000 US dollars
Restaurant labor
458,900,000 US dollars
Restaurant expenses
365,900,000 US dollars
Depreciation and amortization
55,700,000 US dollars
General and administrative
63,300,000 US dollars
Other (gains) and charges
2,400,000 US dollars

Chart connections

  • Revenue less cost of revenue equals gross profit; gross profit less operating expenses equals operating income.
  • Operating income plus other income or expense equals income before tax. Income before tax less income tax expense or benefit equals net income.
BRINKER INTERNATIONAL, INC. (EAT) FY2027 Q1 Revenue by Business Segment by Product and Service Sankey chart
Free to share unchanged, with credit to Plicit.ai · CC BY-NC-ND 4.0Download PNG

Intelligent Insights for Investors

What is inside the biggest piece of Brinker's sales?

Chili's is the biggest piece: its listed products brought in 94% of Brinker's sales this quarter. Company sales made up 99% of those products.

What drove the change in Brinker's biggest business over the past year?

Mostly Company sales: they added $130.30 M of the $131.00 M rise in Chili's revenue from a year earlier. Chili's franchise line supplied the other $0.70 M.

Which sub-unit gained the most share inside Brinker's largest business?

Company sales gained the most: it made up 99.0% of the group's revenue shown here this quarter, against 98.9% a year earlier. Franchise revenues lost the most share.

Intelligent Insights for Lenders

How much does Brinker depend on the biggest piece of its sales?

Heavily: Chili's company sales brought in 93% of these sales this quarter, against 6% for Maggiano's company sales, the next largest. Chili's company-run sales are the exposure a lender would test first.

Product waitlist

Health Check and Teardown for your own company

A health check uncovers insights of your private books, not a public ticker. Join this list to get notified as soon as we go-live!