
ENTEGRIS INC (ENTG) FY2024 YTD Q2 P&L / Income Statement

Revenue by Business Segment by Geography

2024-01-01 to 2024-06-29

Swipe to see the full flow
ENTEGRIS INC (ENTG) FY2024 YTD Q2 P&L / Income StatementIncome statement for 2024-01-01 through 2024-06-29. View: Segments by Geographical. Revenue uses this breakdown; costs and expenses retain the consolidated categories.SOURCESREVENUE RECONCILIATIONREVENUEGROSSOPERATINGPRE-TAXNETMaterials Solutions MS - UNITED STATESMicrocontamination Control MC - TAIWANMicrocontamination Control MC - CHINAMaterials Solutions MS - CHINAMaterials Solutions MS - TAIWANAdvanced Materials Handling AMH - UNITED STATESMaterials Solutions MS - KOREA, REPUBLIC OFMicrocontamination Control MC - UNITED STATESAdvanced Materials Handling AMH - CHINAMicrocontamination Control MC - JAPANMaterials Solutions MS - Southeast AsiaMicrocontamination Control MC - KOREA, REPUBLIC OFMaterials Solutions MS - EuropeAdvanced Materials Handling AMH - TAIWANMaterials Solutions MS - JAPANMicrocontamination Control MC - EuropeAdvanced Materials Handling AMH - KOREA, REPUBLIC OFAdvanced Materials Handling AMH - EuropeMicrocontamination Control MC - Southeast AsiaAdvanced Materials Handling AMH - JAPANAdvanced Materials Handling AMH - Southeast AsiaNet SalesRevenue before reconciliation (calculated)intersegment elimination - UNITED STATESGross profitCost of salesOperating incomeOperating costs, net of other operating income (calculated)Selling, general and administrative expensesEngineering, research and development expensesAmortization of intangible assetsIncome before income tax expense (benefit)Other income (expense), net (calculated)Net incomeIncome tax expense (benefit)Equity in net loss of affiliatesRevenue before reconciliation (calculated)Revenue beforereconciliation(calculated)$1.61 BIncome before income tax expense (benefit)Income before incometax expense (benefit)$123.53 MNet SalesNet Sales$1.58 BGross profitGross profit$727.64 MOperating incomeOperating income$247.70 MNet incomeNet income$112.96 MMaterials Solutions MS - UNITED STATESMaterials SolutionsMS - UNITED STATES$175.57 MOperating costs, net of other operating income (calculated)Operating costs,net (calculated)$479.94 MMicrocontamination Control MC - TAIWANMicrocontaminationControl MC - TAIWAN$141.81 MIncome tax expense (benefit)Income taxexpense (benefit)$10.15 MSelling, general and administrative expensesSelling, general andadministrative expenses$228.51 MOther income (expense), net (calculated)Other income,net (calculated)−$124.17 MMicrocontamination Control MC - CHINAMicrocontaminationControl MC - CHINA$124.02 MCost of salesCost of sales$856.04 MEngineering, research and development expensesEngineering, research anddevelopment expenses$153.76 MEquity in net loss of affiliatesEquity in netloss of affiliates−$423.00 KMaterials Solutions MS - CHINAMaterials SolutionsMS - CHINA$118.95 MAmortization of intangible assetsAmortization of intangible assets$97.67 MMaterials Solutions MS - TAIWANMaterials SolutionsMS - TAIWAN$113.47 MAdvanced Materials Handling AMH - UNITED STATESAdvanced MaterialsHandling AMH -UNITED STATES$112.02 Mintersegment elimination - UNITED STATESintersegmentelimination -UNITED STATES−$21.40 MMaterials Solutions MS - KOREA, REPUBLIC OFMaterials Solutions MS- KOREA, REPUBLIC OF$97.32 MMicrocontamination Control MC - UNITED STATESMicrocontaminationControl MC -UNITED STATES$88.37 MAdvanced Materials Handling AMH - CHINAAdvanced MaterialsHandling AMH - CHINA$75.93 MMicrocontamination Control MC - JAPANMicrocontaminationControl MC - JAPAN$67.52 MMaterials Solutions MS - Southeast AsiaMaterials SolutionsMS - Southeast Asia$65.83 MMicrocontamination Control MC - KOREA, REPUBLIC OFMicrocontaminationControl MC - KOREA,REPUBLIC OF$62.26 MMaterials Solutions MS - EuropeMaterials SolutionsMS - Europe$62.17 MAdvanced Materials Handling AMH - TAIWANAdvanced MaterialsHandling AMH - TAIWAN$59.88 MMaterials Solutions MS - JAPANMaterials SolutionsMS - JAPAN$59.05 MMicrocontamination Control MC - EuropeMicrocontaminationControl MC - Europe$47.97 MAdvanced Materials Handling AMH - KOREA, REPUBLIC OFAdvanced MaterialsHandling AMH -KOREA, REPUBLIC OF$42.69 MAdvanced Materials Handling AMH - EuropeAdvanced MaterialsHandling AMH - Europe$32.25 MMicrocontamination Control MC - Southeast AsiaMicrocontaminationControl MC -Southeast Asia$29.69 MAdvanced Materials Handling AMH - JAPANAdvanced MaterialsHandling AMH - JAPAN$15.74 MAdvanced Materials Handling AMH - Southeast AsiaAdvanced MaterialsHandling AMH -Southeast Asia$12.59 M
Chart details

ENTEGRIS INC (ENTG) FY2024 YTD Q2 P&L / Income Statement

Income statement for 2024-01-01 through 2024-06-29. View: Segments by Geographical. Revenue uses this breakdown; costs and expenses retain the consolidated categories.

Net Sales
1,583,677,000 US dollars
Cost of sales
856,038,000 US dollars
Gross profit
727,639,000 US dollars
Operating costs, net of other operating income (calculated)
479,941,000 US dollars
Operating income
247,698,000 US dollars
Other income (expense), net (calculated)
negative 124,168,000 US dollars
Income before income tax expense (benefit)
123,530,000 US dollars
Income tax expense (benefit)
10,145,000 US dollars
Net income
112,962,000 US dollars
Advanced Materials Handling AMH - CHINA
75,929,000 US dollars
Advanced Materials Handling AMH - JAPAN
15,736,000 US dollars
Advanced Materials Handling AMH - KOREA, REPUBLIC OF
42,687,000 US dollars
Advanced Materials Handling AMH - TAIWAN
59,882,000 US dollars
Advanced Materials Handling AMH - UNITED STATES
112,015,000 US dollars
Advanced Materials Handling AMH - Southeast Asia
12,585,000 US dollars
Advanced Materials Handling AMH - Europe
32,245,000 US dollars
intersegment elimination - CHINA
0 US dollars
intersegment elimination - JAPAN
0 US dollars
intersegment elimination - KOREA, REPUBLIC OF
0 US dollars
intersegment elimination - TAIWAN
0 US dollars
intersegment elimination - Southeast Asia
0 US dollars
intersegment elimination - Europe
0 US dollars
Materials Solutions MS - CHINA
118,953,000 US dollars
Materials Solutions MS - JAPAN
59,053,000 US dollars
Materials Solutions MS - KOREA, REPUBLIC OF
97,316,000 US dollars
Materials Solutions MS - TAIWAN
113,468,000 US dollars
Materials Solutions MS - UNITED STATES
175,574,000 US dollars
Materials Solutions MS - Southeast Asia
65,833,000 US dollars
Materials Solutions MS - Europe
62,172,000 US dollars
Microcontamination Control MC - CHINA
124,021,000 US dollars
Microcontamination Control MC - JAPAN
67,521,000 US dollars
Microcontamination Control MC - KOREA, REPUBLIC OF
62,262,000 US dollars
Microcontamination Control MC - TAIWAN
141,806,000 US dollars
Microcontamination Control MC - UNITED STATES
88,366,000 US dollars
Microcontamination Control MC - Southeast Asia
29,690,000 US dollars
Microcontamination Control MC - Europe
47,967,000 US dollars
Selling, general and administrative expenses
228,508,000 US dollars
Goodwill, Impairment Loss
0 US dollars
Amortization of intangible assets
97,672,000 US dollars
Engineering, research and development expenses
153,761,000 US dollars
Gain on termination of alliance agreement
0 US dollars
Revenue before reconciliation (calculated)
1,605,081,000 US dollars. Sum of the reported revenue categories before the separately reported reconciliation.
intersegment elimination - UNITED STATES
negative 21,404,000 US dollars. Reported reconciliation to consolidated revenue.
Equity in net loss of affiliates
negative 423,000 US dollars. Reported below-tax contribution to net income.

Chart connections

  • Revenue less cost of revenue equals gross profit; gross profit less operating expenses equals operating income.
  • Operating income plus other income or expense equals income before tax. Income before tax less income tax expense or benefit, plus the explicitly reported below-tax contributions, equals net income.
  • Reported revenue categories plus the separately reported signed reconciliation equals consolidated revenue.
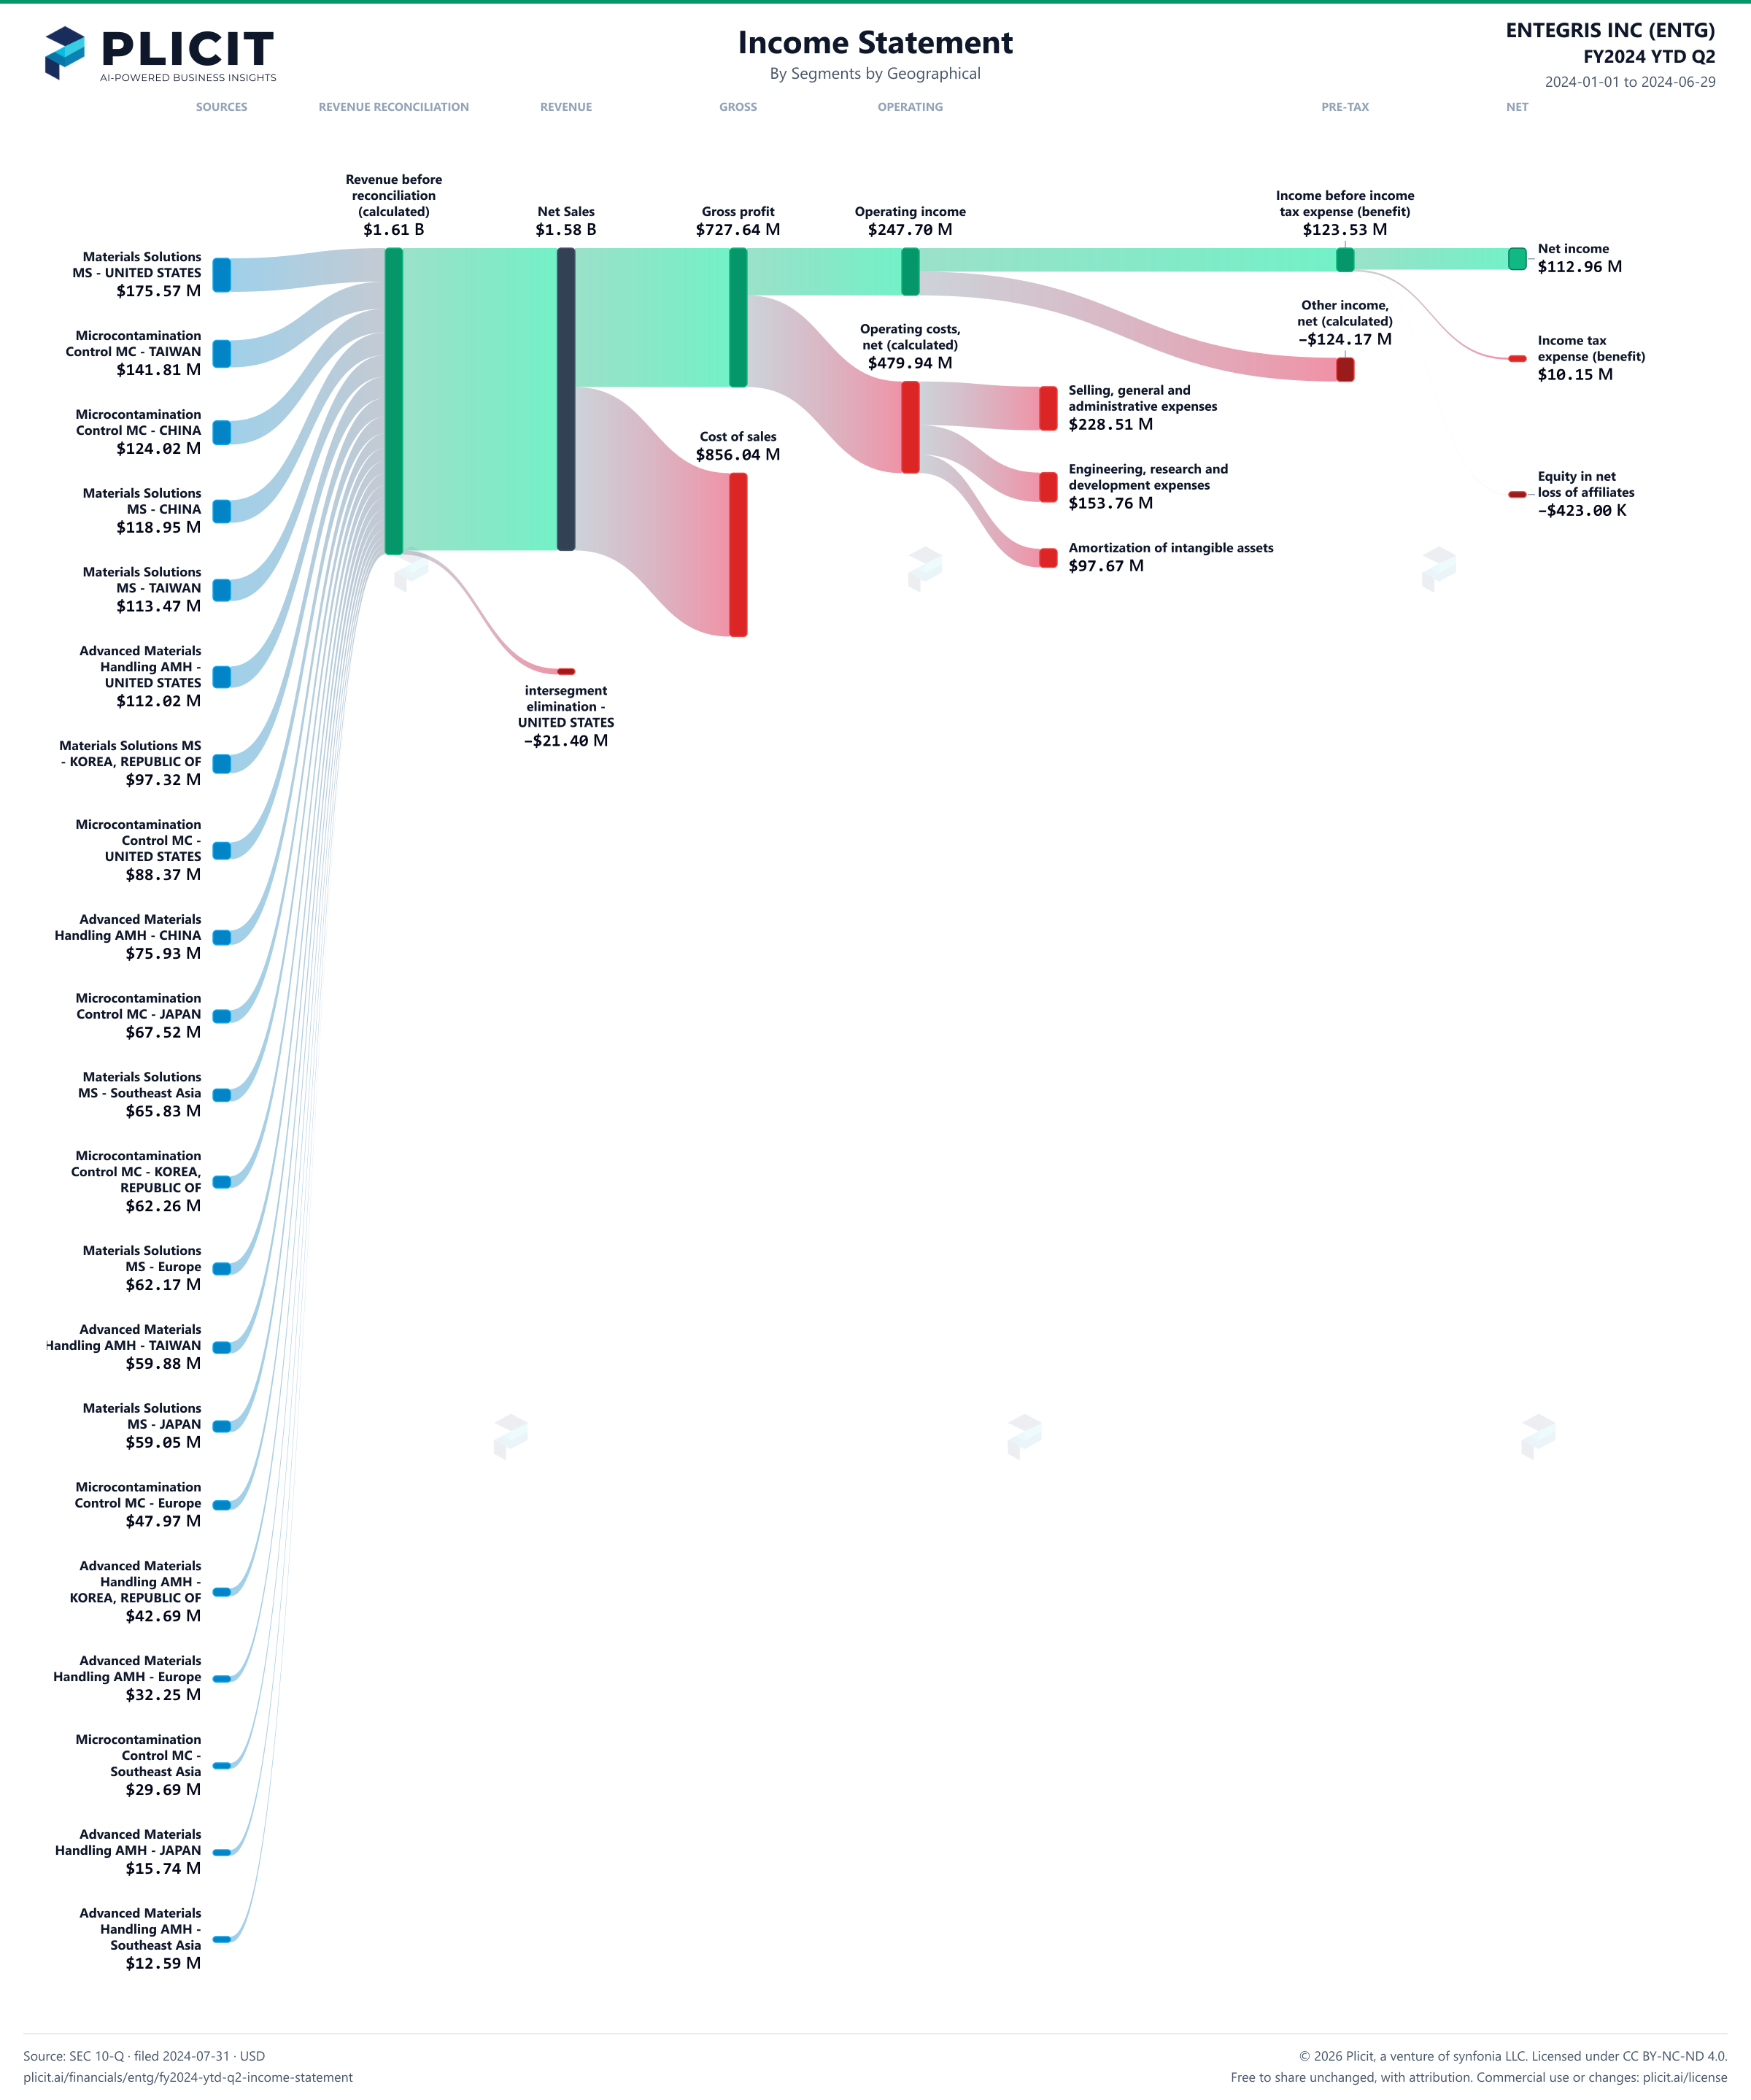
ENTEGRIS INC (ENTG) FY2024 YTD Q2 P&L / Income Statement Sankey chart, Segments by Geographical view
Free to share unchanged, with credit to Plicit.ai · CC BY-NC-ND 4.0Download PNG

Gross margin

45.9%

Gross profit / revenue

Operating margin

15.6%

Operating profit / revenue

Cash conversion

228.7%

Operating cash / net income, same period

Newsletter

Get the teardowns by email

Subscribe if you want the public-company teardowns in your inbox when they're released.

Product waitlist

Health Check and Teardown for your own company

A health check uncovers insights of your private books, not a public ticker. Join this list to get notified as soon as we go-live!