
ENTEGRIS INC (ENTG) FY2024 Q2 Balance Sheet
As of 2024-06-29
Balance Sheet
As of 2024-06-29
Swipe to see the full flow
Chart details
ENTEGRIS INC (ENTG) FY2024 Q2 Balance Sheet
Balance sheet as of 2024-06-29. The chart shows assets, liabilities and equity at that date.
- Assets
- 8,336,586,000 US dollars
- Current assets
- 1,576,786,000 US dollars
- Non-current assets
- 6,759,800,000 US dollars
- Liabilities (calculated)
- 4,834,196,000 US dollars
- Current liabilities
- 439,858,000 US dollars
- Non-current liabilities
- 4,394,338,000 US dollars
- Equity
- 3,502,390,000 US dollars
- Inventories, net
- 633,373,000 US dollars
- Trade accounts receivable, net of allowance for credit losses of $5,509 and $6,412
- 457,107,000 US dollars
- Cash and cash equivalents
- 320,008,000 US dollars
- Other current assets
- 107,413,000 US dollars
- Deferred tax charges and refundable income taxes
- 52,690,000 US dollars
- Assets held-for-sale
- 6,195,000 US dollars
- Goodwill
- 3,943,893,000 US dollars
- Property, plant and equipment, net of accumulated depreciation of $983,070 and $908,089
- 1,495,098,000 US dollars
- Intangible assets, net of accumulated amortization of $906,496 and $808,298
- 1,184,955,000 US dollars
- Right-of-use assets - Operating lease
- 61,396,000 US dollars
- Other assets
- 28,085,000 US dollars
- Deferred tax assets and other noncurrent tax assets
- 24,059,000 US dollars
- Right-of-use assets - Finance lease
- 22,314,000 US dollars
- Accounts payable
- 141,579,000 US dollars
- Other accrued liabilities
- 120,538,000 US dollars
- Accrued payroll and related benefits
- 90,303,000 US dollars
- Income taxes payable
- 62,416,000 US dollars
- Accrued interest payable
- 24,360,000 US dollars
- Liabilities held-for-sale
- 662,000 US dollars
- Long-term debt, net of unamortized discount and debt issuance costs of $72,767 and $91,633
- 4,122,233,000 US dollars
- Deferred tax liabilities and other noncurrent tax liabilities
- 146,516,000 US dollars
- Pension benefit obligations and other liabilities
- 53,789,000 US dollars
- Long term lease liability - Operating lease
- 52,332,000 US dollars
- Long term lease liability - Finance lease
- 19,468,000 US dollars
- Additional paid-in capital
- 2,335,321,000 US dollars
- Retained earnings
- 1,234,487,000 US dollars
- Common stock, par value $0.01; 400,000 shares authorized; issued and outstanding shares as of June 29, 2024: 151,029 and 150,827, respectively; issued and outstanding shares as of December 31, 2023: 150,566 and 150,364, respectively
- 1,510,000 US dollars
- Preferred stock, par value $0.01; 5,000 shares authorized; none issued and outstanding as of June 29, 2024 and December 31, 2023
- 0 US dollars
- Accumulated other comprehensive loss
- negative 61,816,000 US dollars
- Treasury stock, at cost: 202 shares held as of June 29, 2024 and December 31, 2023
- negative 7,112,000 US dollars
- Gross equity (calculated)
- 3,571,318,000 US dollars. Net equity plus the magnitudes of its negative contributions equals gross positive equity. The negative contributions enter this reconciliation as add-backs; their filed signs stay negative.
Chart connections
- Assets equal liabilities plus consolidated equity. Consolidated equity includes noncontrolling interests when reported.
- Treasury shares and other negative equity contributions reduce equity.
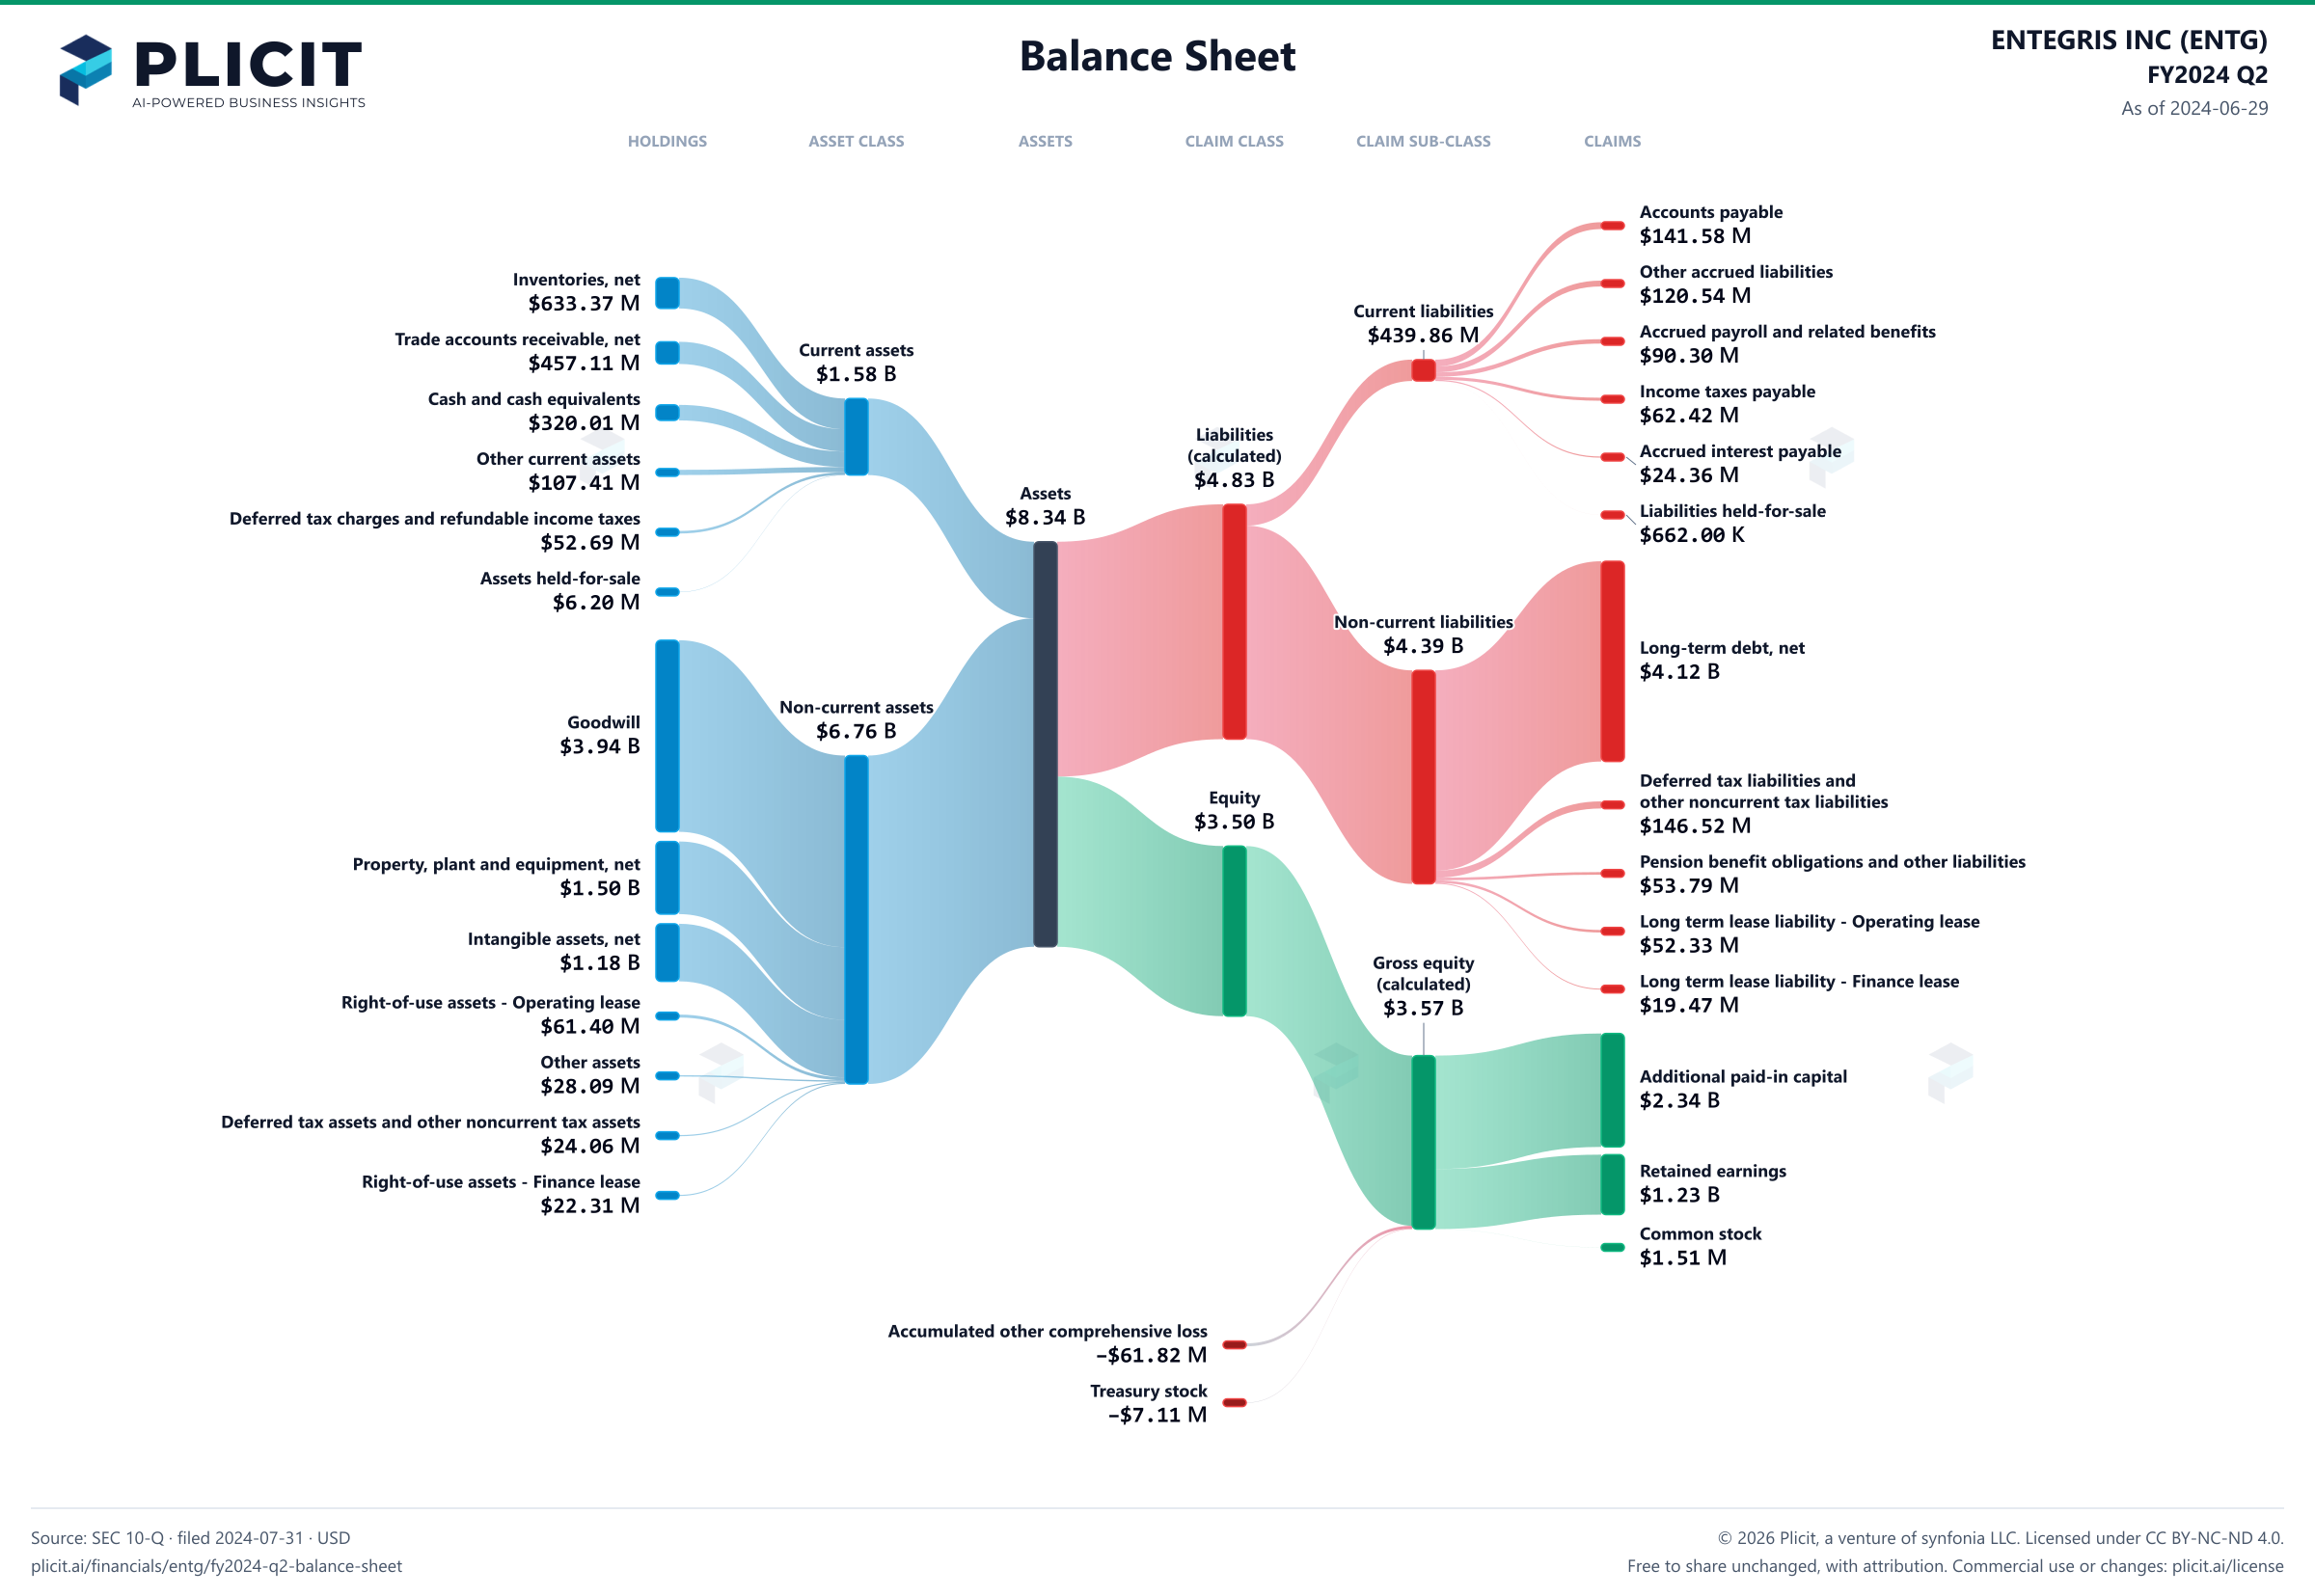
Free to share unchanged, with credit to Plicit.ai · CC BY-NC-ND 4.0Download PNG
Product waitlist
Health Check and Teardown for your own company
A health check uncovers insights of your private books, not a public ticker. Join this list to get notified as soon as we go-live!