
Hilton Grand Vacations Inc. (HGV) FY2026 Q3 P&L / Income Statement

Published · Updated Source: Form 10-Q on SEC EDGAR filed (opens in a new tab)

Key Takeaways

  • Real estate sales and financing supplied $629.00 M of the $661.00 M revenue rise, 95% of it.
  • Cost reimbursements of $153.00 M are booked as revenue and matched by the same amount of cost.
  • Take those out, and real estate sales and financing is 78% of the remaining sales.
  • Resort operations and club management grew only 2.9%, to $390.00 M, against 51% for revenue.
  • Real estate sales and financing grew 79.7%, while cost reimbursements rose 15.9% to $153.00 M.

The Unvarnished Truth

One segment supplied 95% of the revenue rise this quarter

The filing books $153.00 M of cost reimbursements as revenue and spends the same $153.00 M on costs. Take them out, and real estate sales and financing is 78% of the rest of the sales. The resort business grew 2.9%, from $379.00 M to $390.00 M, while real estate grew 79.7%. Reading the view this way makes the growth look like one segment's, not the whole company's. Numbers this tidy usually hide a moving part, so the next step is the segment's timing.

Revenue overall rose $661.00 M, and real estate supplied $629.00 M of that rise. Cost reimbursements rose too, by 15.9%, to $153.00 M. Those reimbursements add the same amount to revenue and to cost, so they flatter the top line but leave profit where it was. The real estate growth is the part to test, and the company's own notes already point to timing as its main cause. That is the first thing to check before reading the segment's growth as demand.

Resort operations and club management grew from $379.00 M to $390.00 M, the slow line in this view. Real estate grew 79.7% over the same stretch, and the notes tie much of that to when projects finished. A reader who sees only the total would miss that the segment that grew fastest is also the one most exposed to timing. If real estate sales follow construction completion, what would this view show in a quarter when no projects finish?
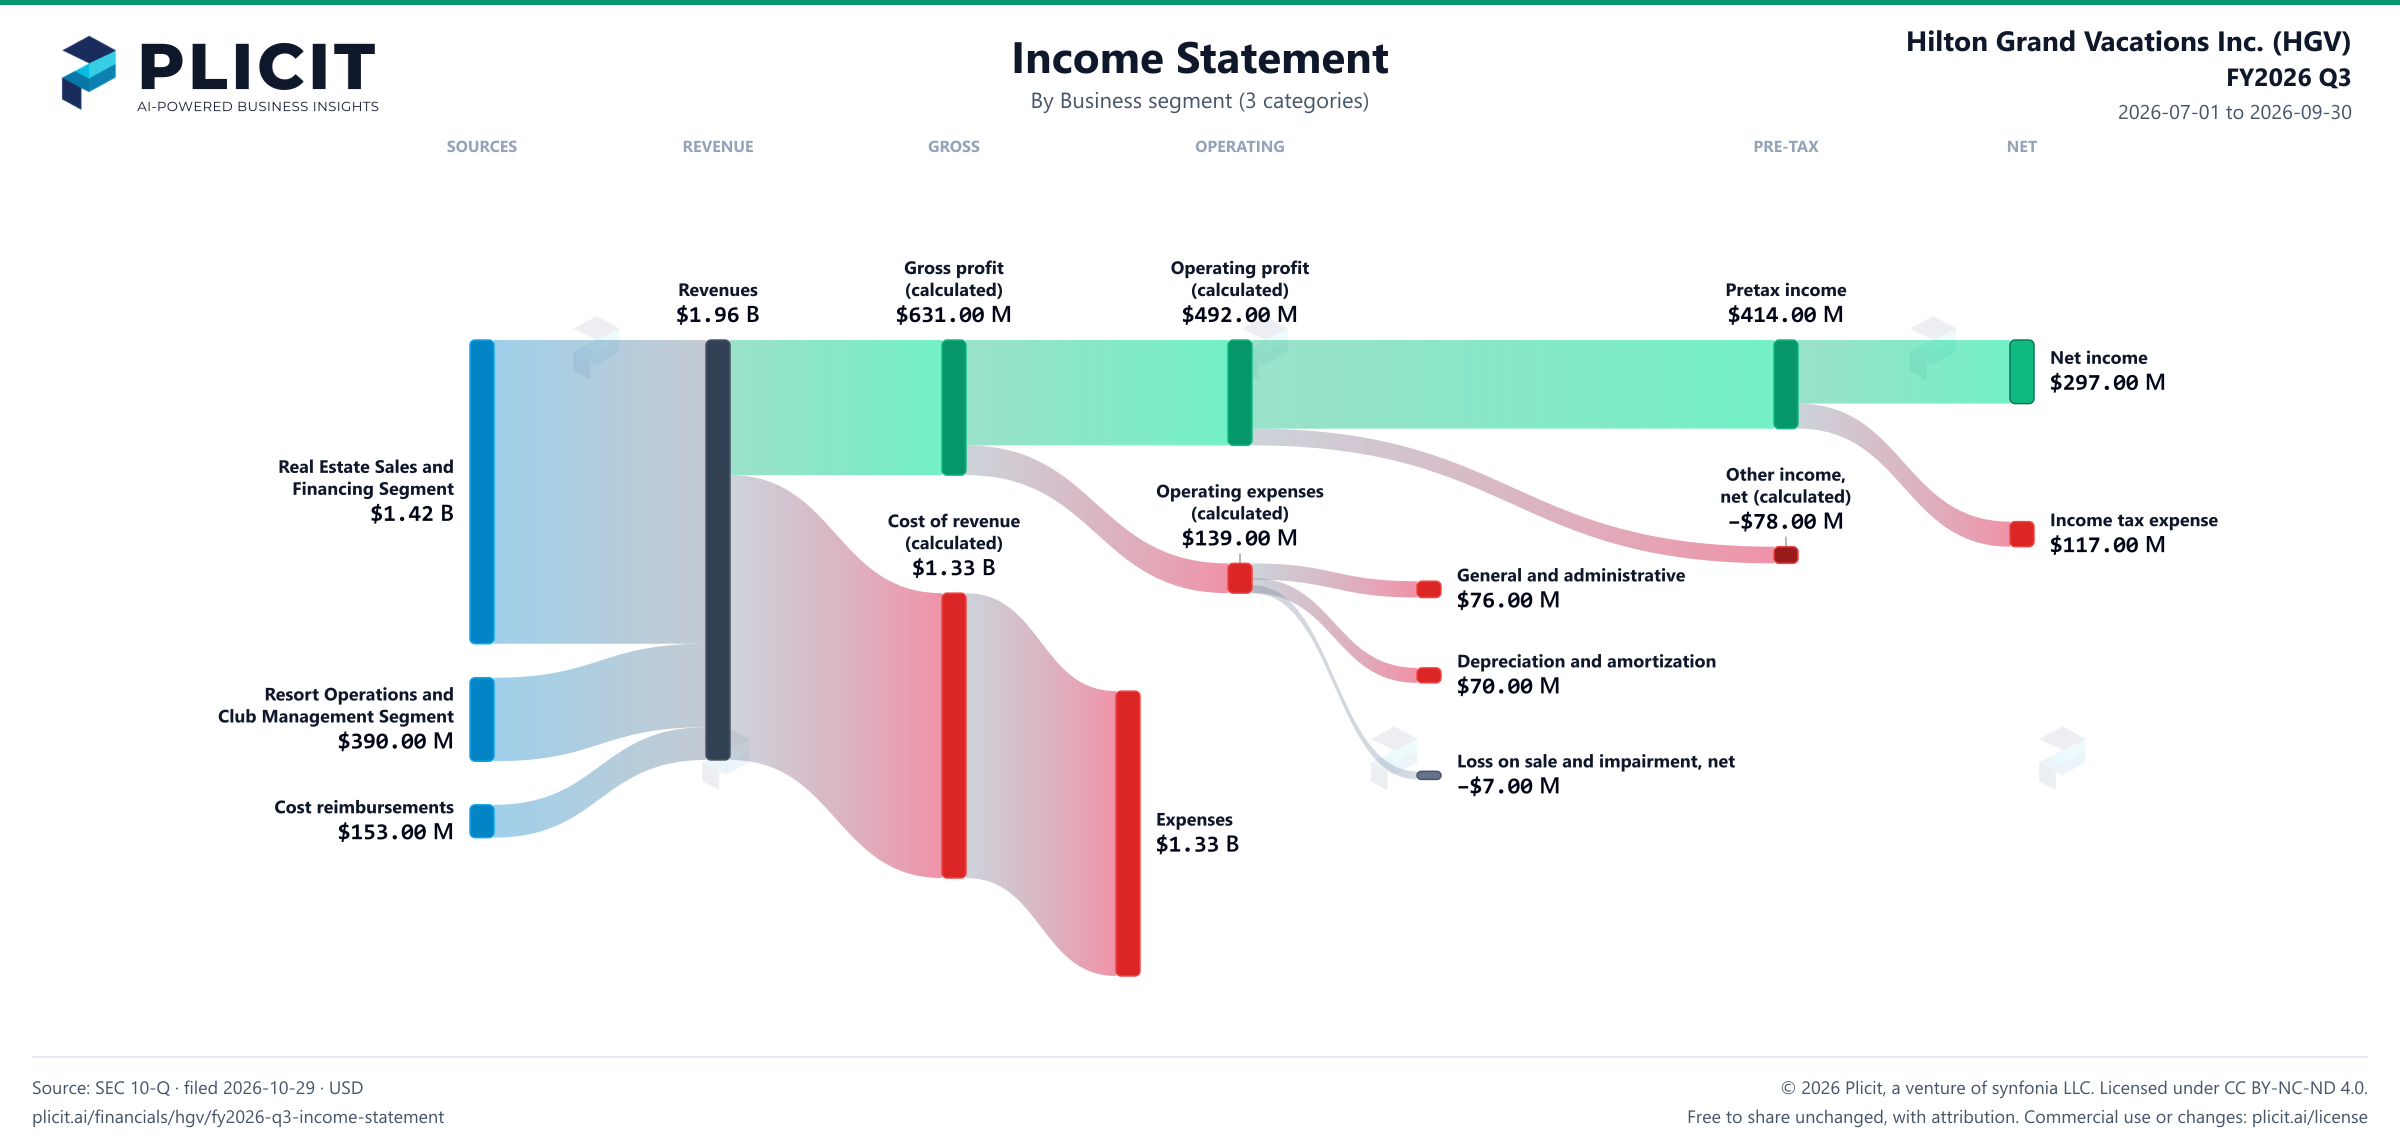
Revenue by Business Segment (3 categories)

Swipe to see the full flow
Hilton Grand Vacations Inc. (HGV) FY2026 Q3 P&L / Income StatementIncome statement for 2026-07-01 through 2026-09-30. View: Business segment (3 categories). Revenue uses this breakdown; costs and expenses retain the consolidated categories.SOURCESREVENUEGROSSOPERATINGPRE-TAXNETReal Estate Sales and Financing SegmentResort Operations and Club Management SegmentCost reimbursementsRevenuesGross profit (calculated)Cost of revenue (calculated)ExpensesOperating profit (calculated)Operating expenses (calculated)General and administrativeDepreciation and amortizationLoss on sale and impairment, netIncome before income taxesOther income (expense), net (calculated)Net incomeIncome tax expenseGross profit (calculated)Gross profit(calculated)$631.00 MOperating profit (calculated)Operating profit(calculated)$492.00 MRevenuesRevenues$1.96 BIncome before income taxesPretax income$414.00 MNet incomeNet income$297.00 MReal Estate Sales and Financing SegmentReal Estate Sales andFinancing Segment$1.42 BOperating expenses (calculated)Operating expenses(calculated)$139.00 MIncome tax expenseIncome tax expense$117.00 MCost of revenue (calculated)Cost of revenue(calculated)$1.33 BGeneral and administrativeGeneral and administrative$76.00 MOther income (expense), net (calculated)Other income,net (calculated)−$78.00 MDepreciation and amortizationDepreciation and amortization$70.00 MResort Operations and Club Management SegmentResort Operations andClub Management Segment$390.00 MLoss on sale and impairment, netLoss on sale and impairment, net−$7.00 MCost reimbursementsCost reimbursements$153.00 MExpensesExpenses$1.33 B
Chart details

Hilton Grand Vacations Inc. (HGV) FY2026 Q3 P&L / Income Statement

Income statement for 2026-07-01 through 2026-09-30. View: Business segment (3 categories). Revenue uses this breakdown; costs and expenses retain the consolidated categories.

Revenues
1,961,000,000 US dollars
Cost of revenue (calculated)
1,330,000,000 US dollars
Gross profit (calculated)
631,000,000 US dollars
Operating expenses (calculated)
139,000,000 US dollars
Operating profit (calculated)
492,000,000 US dollars
Other income (expense), net (calculated)
negative 78,000,000 US dollars
Income before income taxes
414,000,000 US dollars
Income tax expense
117,000,000 US dollars
Net income
297,000,000 US dollars
Real Estate Sales and Financing Segment
1,418,000,000 US dollars
Resort Operations and Club Management Segment
390,000,000 US dollars
Cost reimbursements
153,000,000 US dollars
Expenses
1,330,000,000 US dollars
General and administrative
76,000,000 US dollars
Depreciation and amortization
70,000,000 US dollars
Loss on sale and impairment, net
negative 7,000,000 US dollars

Chart connections

  • Revenue less cost of revenue equals gross profit; gross profit less operating expenses equals operating income.
  • Operating income plus other income or expense equals income before tax. Income before tax less income tax expense or benefit equals net income.
  • Of which attributable to Hilton Grand Vacations Inc.: $291.00 M; to noncontrolling interests: $6.00 M.
Hilton Grand Vacations Inc. (HGV) FY2026 Q3 Revenue by Business Segment (3 categories) Sankey chart
Free to share unchanged, with credit to Plicit.ai · CC BY-NC-ND 4.0Download PNG

Intelligent Insights for Investors

How has the mix of Hilton Grand Vacations' sales by business shifted over the past year?

Toward real estate sales and financing: it made up 72% of revenue this quarter, against 61% a year earlier, while resort operations and club management fell from 29% to 20% of revenue.

Which part of Hilton Grand Vacations' sales by business lost the most ground over the past year?

None of the parts shrank. Resort operations and club management gained least: it grew 2.9% from a year earlier, against 51% for revenue as a whole.

Intelligent Insights for Everyone

Which of Hilton Grand Vacations' businesses brings in the most sales?

Real estate sales and financing, by far, at 72% of revenue, against 20% for resort operations and club management, the next largest.

Product waitlist

Health Check and Teardown for your own company

A health check uncovers insights of your private books, not a public ticker. Join this list to get notified as soon as we go-live!