
Published Source: Form 10-Q on SEC EDGAR filed (opens in a new tab)

Key Takeaways

  • Net income rose 32% to $36.63 B, but excluding OpenAI swings it rose 18%, to $36.42 B.
  • Azure sales jumped 48% to $33.17 B, passing Microsoft 365 cloud as the largest line.
  • Gross margin slipped to 67.8% of sales from 69.0% as the mix shifted toward Azure.
  • Equipment spending equalled 42.7% of sales, up from 25.0% a year earlier.
  • Contracted future revenue reached $683.00 B, 7.4 times this quarter's sales.

The Unvarnished Truth

Microsoft's 32% profit jump shrinks to 18% without OpenAI swings

Microsoft's net income jumped 32% to $36.63 B in the quarter to September 30, 2026, but the headline flatters. A year earlier, net losses from investments in OpenAI cut net income by $3.10 B; this quarter, gains added $207.00 M. Strip those out, as management's adjusted figure does, and net income grew 18%, slower than sales at 19%. Operating income, the profit from the business itself before investment gains and taxes, rose 21% to $45.92 B. So where is the real growth coming from, and what is it costing the company?

Azure. Its revenue rose 48% to $33.17 B, supplying 74% of the company's $14.61 B increase in sales, and it passed Microsoft 365 cloud as the largest line. Management says the shift has a price: Microsoft Cloud gross margin percentage decreased to 66% driven by sales mix shift to Azure, offset in part by product-level margin improvements. Company-wide, gross margin fell to 67.8% of sales from 69.0%, and Agents and Infra's cost of revenue rose 35%, driven by investments in datacenter infrastructure. Depreciation reached $11.10 B, up from $7.10 B a year earlier. Azure's growth is being bought with servers, and the servers are getting more expensive to carry.

For investors, the business is still extraordinary: 40% of every sales dollar ended as net income. The test is whether that holds as spending on property and equipment, now 42.7% of sales against 25.0% a year earlier, turns into depreciation. Management warns the investments in cloud and datacenter infrastructure "will continue to increase our operating costs and may decrease our operating margins." Backlog gives cover: $683.00 B of contracted revenue, 7.4 times this quarter's sales, though only about 30% is expected over the next 12 months. Can Azure's growth outrun the depreciation bill its own datacenters are writing?
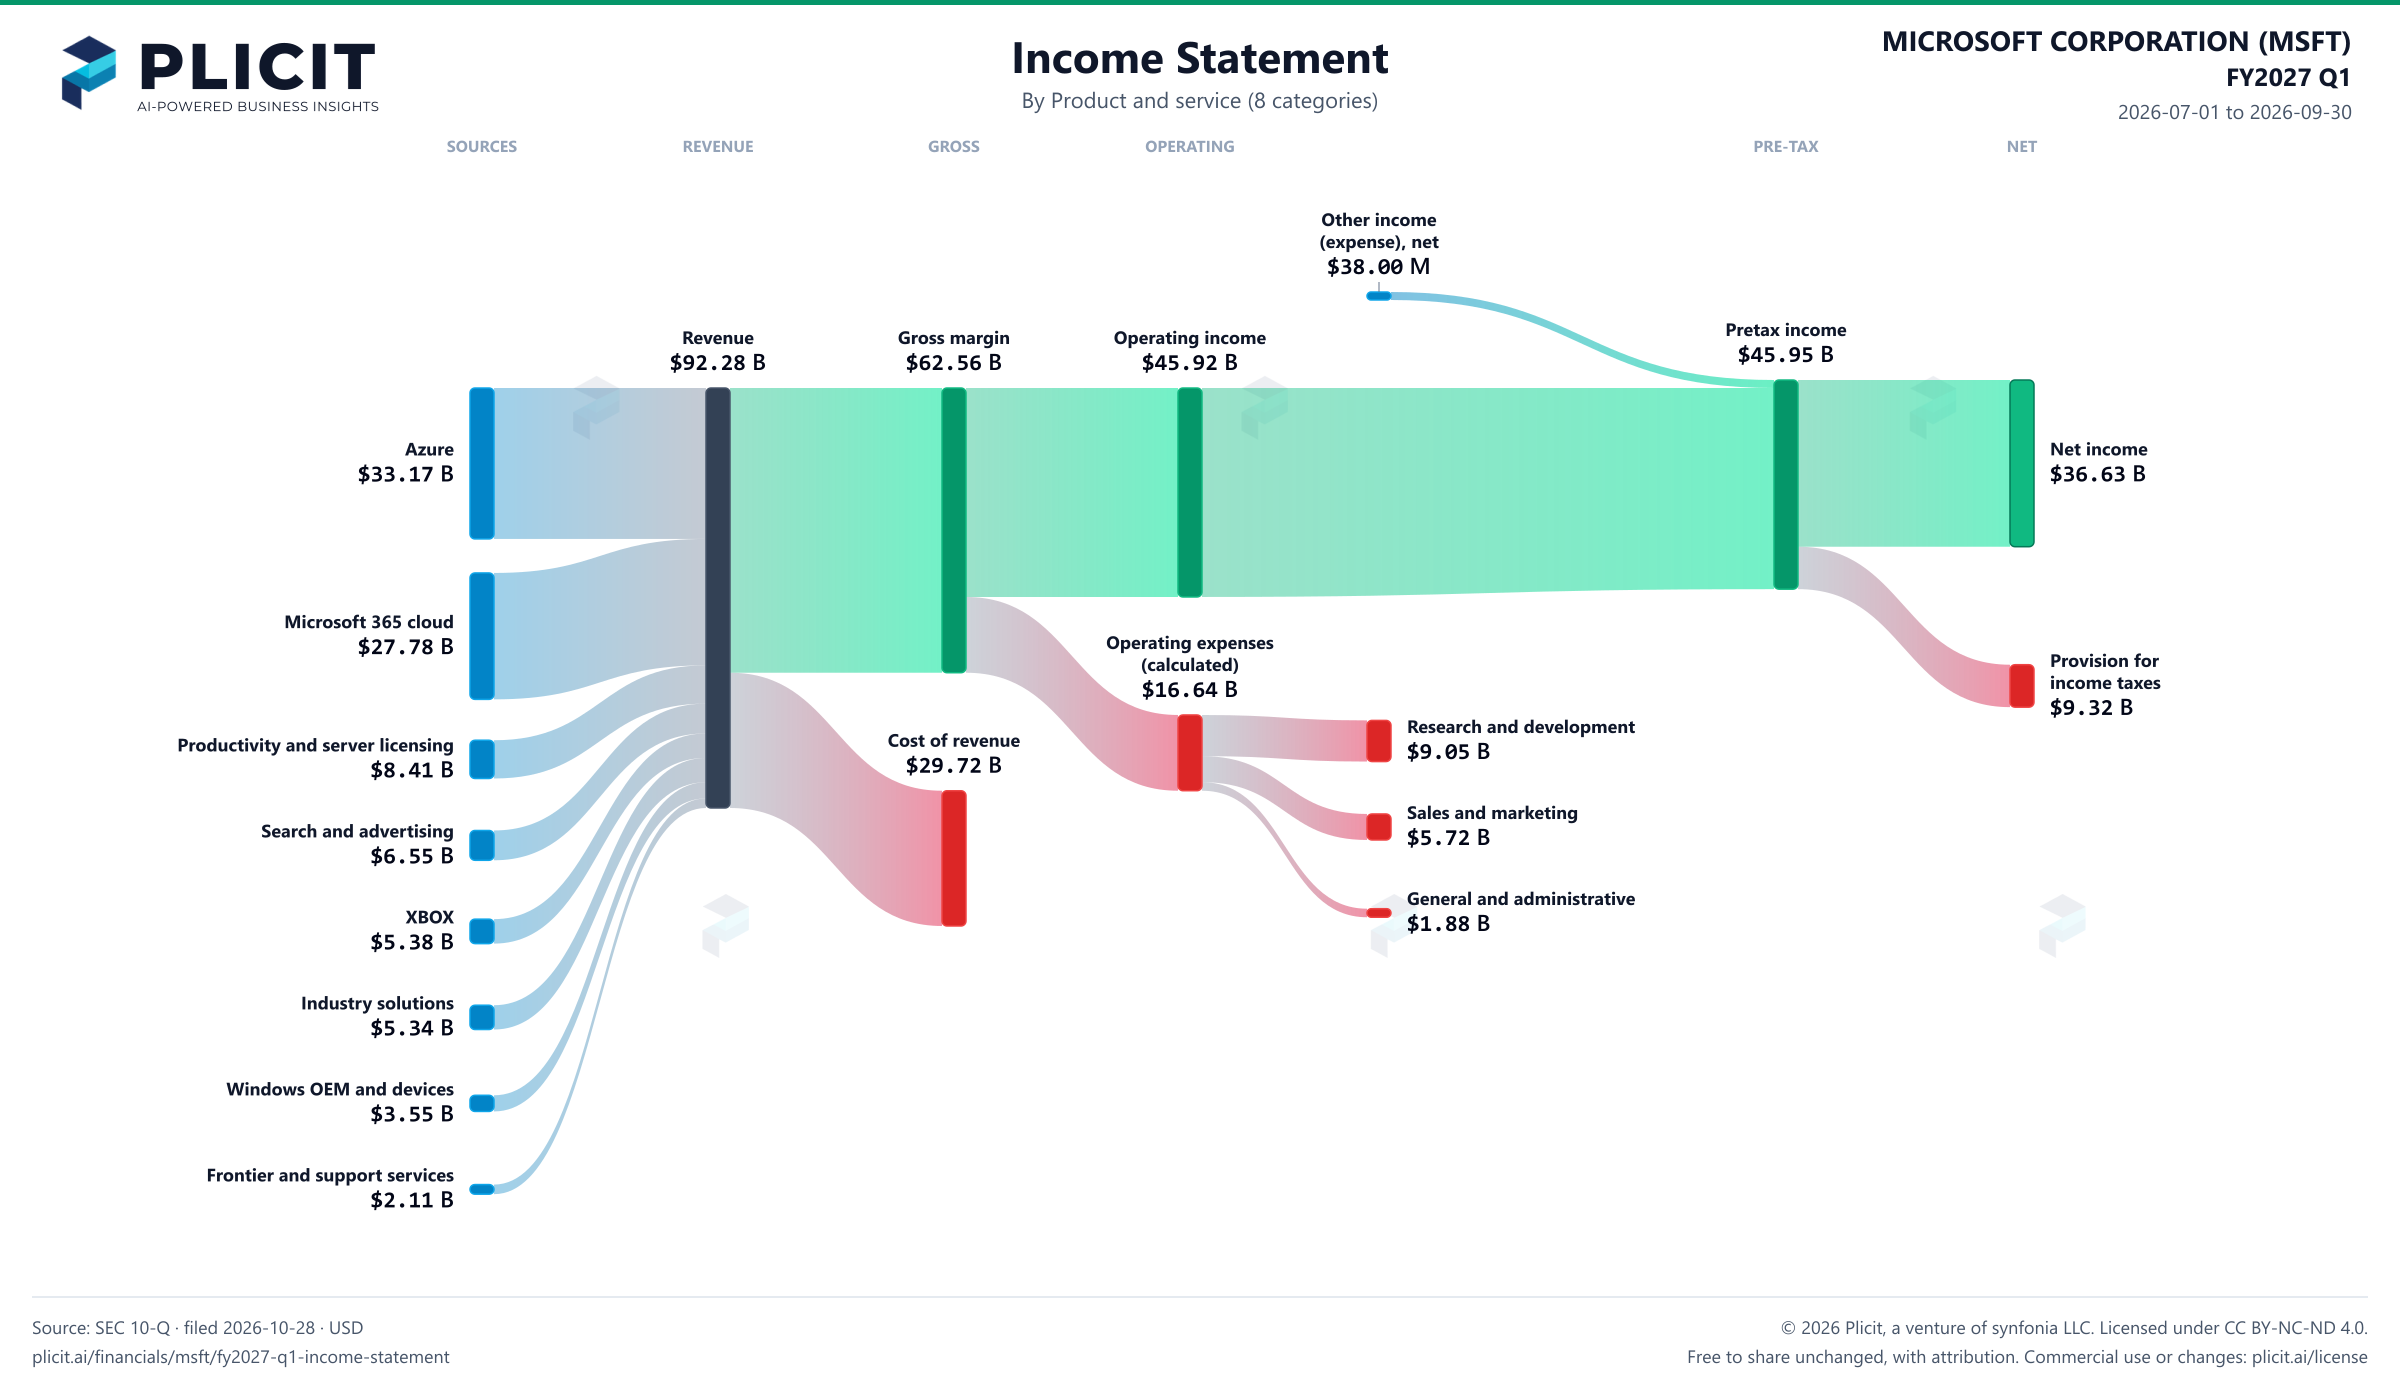
Revenue by Product and Service (8 categories)

Swipe to see the full flow
MICROSOFT CORPORATION (MSFT) FY2027 Q1 P&L / Income StatementIncome statement for 2026-07-01 through 2026-09-30. View: Product and service (8 categories). Revenue uses this breakdown; costs and expenses retain the consolidated categories.SOURCESREVENUEGROSSOPERATINGPRE-TAXNETAzureMicrosoft 365 cloudProductivity and server licensingSearch and advertisingXBOXIndustry solutionsWindows OEM and devicesFrontier and support servicesRevenueGross marginCost of revenueOperating incomeOperating expenses (calculated)Research and developmentSales and marketingGeneral and administrativeOther income (expense), netIncome before income taxesNet incomeProvision for income taxesOther income (expense), netOther income(expense), net$38.00 MIncome before income taxesPretax income$45.95 BRevenueRevenue$92.28 BGross marginGross margin$62.56 BOperating incomeOperating income$45.92 BNet incomeNet income$36.63 BAzureAzure$33.17 BMicrosoft 365 cloudMicrosoft 365 cloud$27.78 BOperating expenses (calculated)Operating expenses(calculated)$16.64 BProvision for income taxesProvision forincome taxes$9.32 BResearch and developmentResearch and development$9.05 BCost of revenueCost of revenue$29.72 BProductivity and server licensingProductivity and server licensing$8.41 BSales and marketingSales and marketing$5.72 BSearch and advertisingSearch and advertising$6.55 BGeneral and administrativeGeneral and administrative$1.88 BXBOXXBOX$5.38 BIndustry solutionsIndustry solutions$5.34 BWindows OEM and devicesWindows OEM and devices$3.55 BFrontier and support servicesFrontier and support services$2.11 B
Chart details

MICROSOFT CORPORATION (MSFT) FY2027 Q1 P&L / Income Statement

Income statement for 2026-07-01 through 2026-09-30. View: Product and service (8 categories). Revenue uses this breakdown; costs and expenses retain the consolidated categories.

Revenue
92,279,000,000 US dollars
Cost of revenue
29,720,000,000 US dollars
Gross margin
62,559,000,000 US dollars
Operating expenses (calculated)
16,644,000,000 US dollars
Operating income
45,915,000,000 US dollars
Other income (expense), net
38,000,000 US dollars
Income before income taxes
45,953,000,000 US dollars
Provision for income taxes
9,324,000,000 US dollars
Net income
36,629,000,000 US dollars
Azure
33,165,000,000 US dollars
Microsoft 365 cloud
27,778,000,000 US dollars
Productivity and server licensing
8,407,000,000 US dollars
Search and advertising
6,554,000,000 US dollars
XBOX
5,379,000,000 US dollars
Industry solutions
5,337,000,000 US dollars
Windows OEM and devices
3,551,000,000 US dollars
Frontier and support services
2,108,000,000 US dollars
Research and development
9,047,000,000 US dollars
Sales and marketing
5,716,000,000 US dollars
General and administrative
1,881,000,000 US dollars

Chart connections

  • Revenue less cost of revenue equals gross profit; gross profit less operating expenses equals operating income.
  • Operating income plus other income or expense equals income before tax. Income before tax less income tax expense or benefit equals net income.
MICROSOFT CORPORATION (MSFT) FY2027 Q1 P&L / Income Statement Sankey chart, Product and service (8 categories) view
Free to share unchanged, with credit to Plicit.ai · CC BY-NC-ND 4.0Download PNG

Intelligent Insights for Investors

Did Microsoft make a profit this quarter?

Yes, $36.63 B this quarter. Its net margin, the share of sales left as profit once every cost is counted, was 40%.

How does Microsoft's adjusted profit compare with its reported profit?

Management's adjusted net income, which excludes net gains and losses from investments in OpenAI, was $36.42 B, against reported net income of $36.63 B. The gap matters more for growth than for size: reported net income rose 32%, adjusted net income 18%.

How much does Microsoft keep after the direct cost of what it sells?

It kept 67.8% of its sales this quarter after the direct cost of what it sold, against 69.0% a year earlier. Management attributes the lower Microsoft Cloud gross margin to sales mix shift to Azure.

Intelligent Insights for Employees

Is Microsoft's research spending keeping pace with its sales?

No: research and development took 9.8% of sales this quarter, against 10.5% a year earlier. Spending still grew 11%, which management attributes to continued investments in compute capacity and talent, while total company headcount decreased 2%.

Intelligent Insights for Suppliers

What is Microsoft's biggest expense?

Cost of revenue tops the list at $29.72 B this quarter, or 32% of what it took in. Next came provision for income taxes, at $9.32 B.

Product waitlist

Health Check and Teardown for your own company

A health check uncovers insights of your private books, not a public ticker. Join this list to get notified as soon as we go-live!