
THERMO FISHER SCIENTIFIC INC. (TMO) FY2025 Annual Balance Sheet
As of 2025-12-31
Balance Sheet
As of 2025-12-31
Swipe to see the full flow
Chart details
THERMO FISHER SCIENTIFIC INC. (TMO) FY2025 Annual Balance Sheet
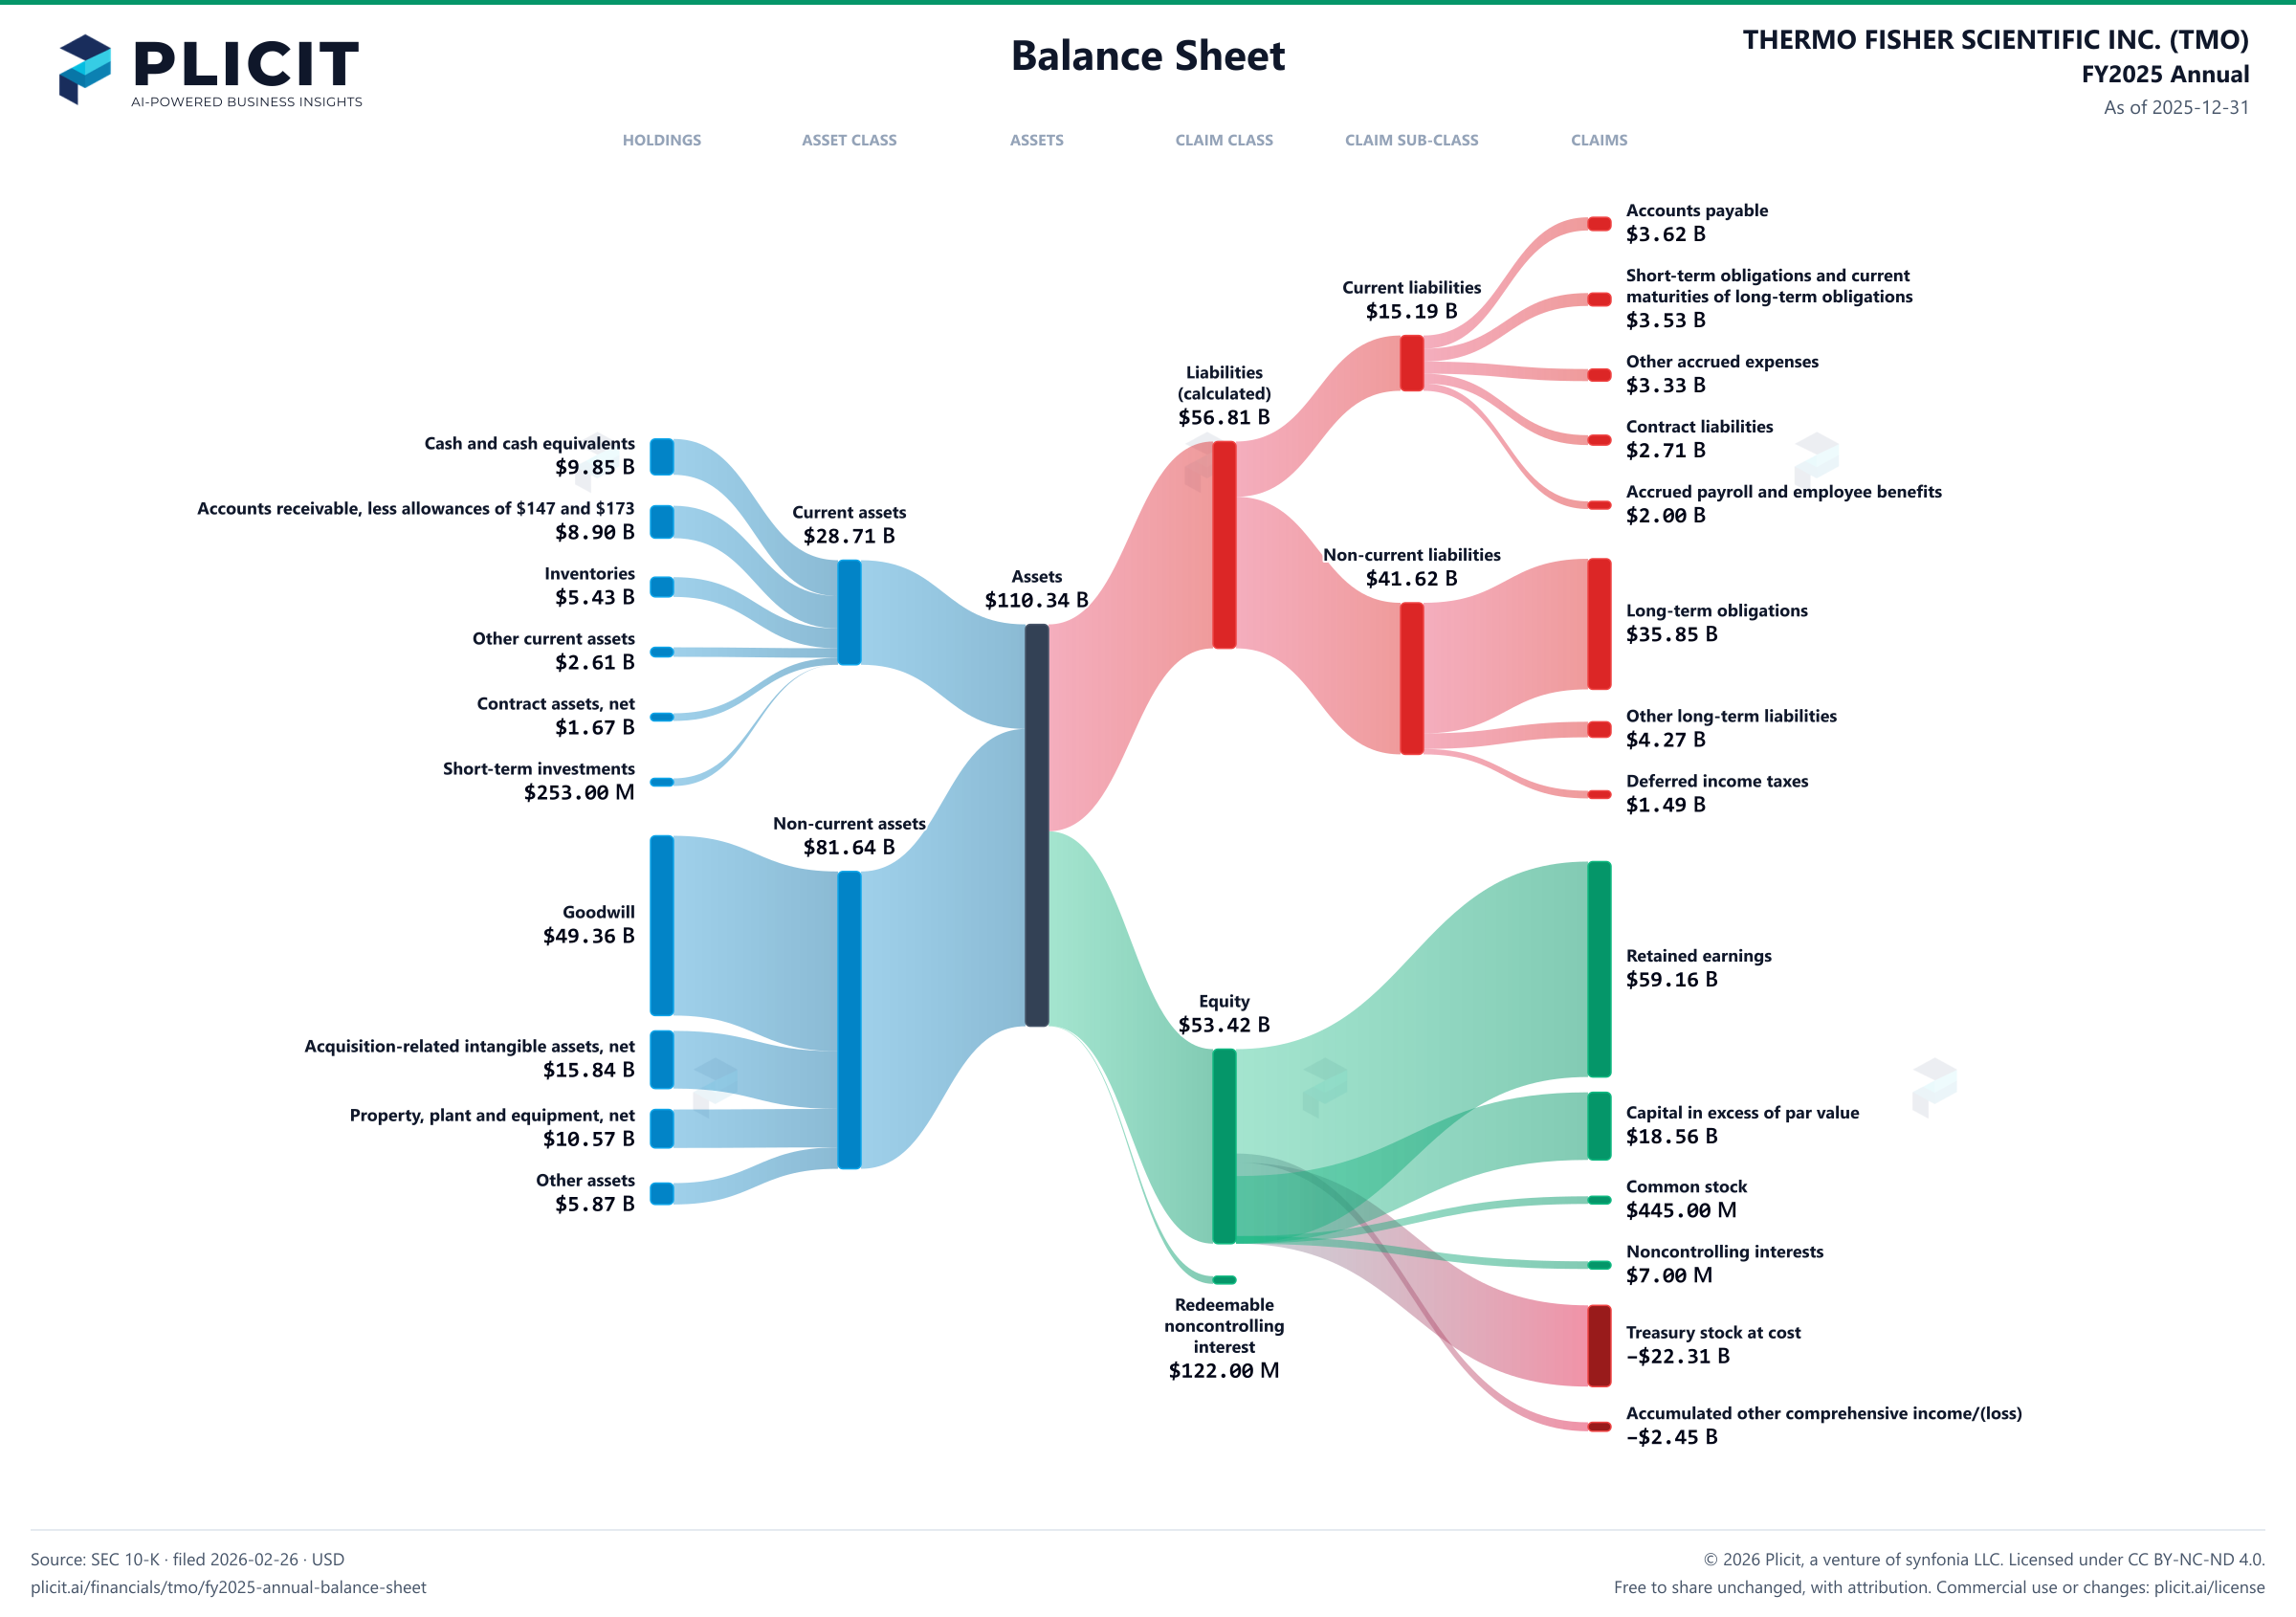
Balance sheet as of 2025-12-31. The chart shows assets, liabilities and equity at that date.
- Assets
- 110,343,000,000 US dollars
- Current assets
- 28,707,000,000 US dollars
- Non-current assets
- 81,636,000,000 US dollars
- Liabilities (calculated)
- 56,806,000,000 US dollars
- Current liabilities
- 15,189,000,000 US dollars
- Non-current liabilities
- 41,617,000,000 US dollars
- Equity
- 53,415,000,000 US dollars
- Redeemable noncontrolling interest
- 122,000,000 US dollars
- Noncontrolling interest
- 7,000,000 US dollars. Included in consolidated equity; this amount is not added again.
- Cash and cash equivalents
- 9,852,000,000 US dollars
- Accounts receivable, less allowances of $147 and $173
- 8,900,000,000 US dollars
- Inventories
- 5,425,000,000 US dollars
- Other current assets
- 2,612,000,000 US dollars
- Contract assets, net
- 1,666,000,000 US dollars
- Short-term investments
- 253,000,000 US dollars
- Goodwill
- 49,362,000,000 US dollars
- Acquisition-related intangible assets, net
- 15,838,000,000 US dollars
- Property, plant and equipment, net
- 10,565,000,000 US dollars
- Other assets
- 5,871,000,000 US dollars
- Accounts payable
- 3,622,000,000 US dollars
- Short-term obligations and current maturities of long-term obligations
- 3,533,000,000 US dollars
- Other accrued expenses
- 3,329,000,000 US dollars
- Contract liabilities
- 2,710,000,000 US dollars
- Accrued payroll and employee benefits
- 1,995,000,000 US dollars
- Long-term obligations
- 35,852,000,000 US dollars
- Other long-term liabilities
- 4,273,000,000 US dollars
- Deferred income taxes
- 1,493,000,000 US dollars
- Retained earnings
- 59,156,000,000 US dollars
- Capital in excess of par value
- 18,563,000,000 US dollars
- Common stock, $1 par value, 1,200,000,000 shares authorized; 445,160,301 and 443,841,240 shares issued
- 445,000,000 US dollars
- Preferred stock, $100 par value, 50,000 shares authorized; none issued
- 0 US dollars
- Noncontrolling interests
- 7,000,000 US dollars
- Treasury stock at cost, 68,938,831 and 63,066,906 shares
- negative 22,309,000,000 US dollars
- Accumulated other comprehensive income/(loss)
- negative 2,448,000,000 US dollars
Chart connections
- Assets equal liabilities plus temporary equity plus consolidated equity. Consolidated equity includes noncontrolling interests when reported.
- Treasury shares and other negative equity contributions reduce equity.
- The filed current assets lines add up to $28,708.00 M and the current assets total is $28,707.00 M; the $1.00 M difference is within the rounding of the filed amounts.
- The filed non-current liabilities lines add up to $41,618.00 M and the non-current liabilities total is $41,617.00 M; the $1.00 M difference is within the rounding of the filed amounts.
- The filed equity lines add up to $53,414.00 M and the equity total is $53,415.00 M; the $1.00 M difference is within the rounding of the filed amounts.
Free to share unchanged, with credit to Plicit.ai · CC BY-NC-ND 4.0Download PNG
Product waitlist
Health Check and Teardown for your own company
A health check uncovers insights of your private books, not a public ticker. Join this list to get notified as soon as we go-live!