
WATTS WATER TECHNOLOGIES INC (WTS) FY2026 Q2 P&L / Income Statement

Published · Updated Source: Form 10-Q on SEC EDGAR filed (opens in a new tab)

Key Takeaways

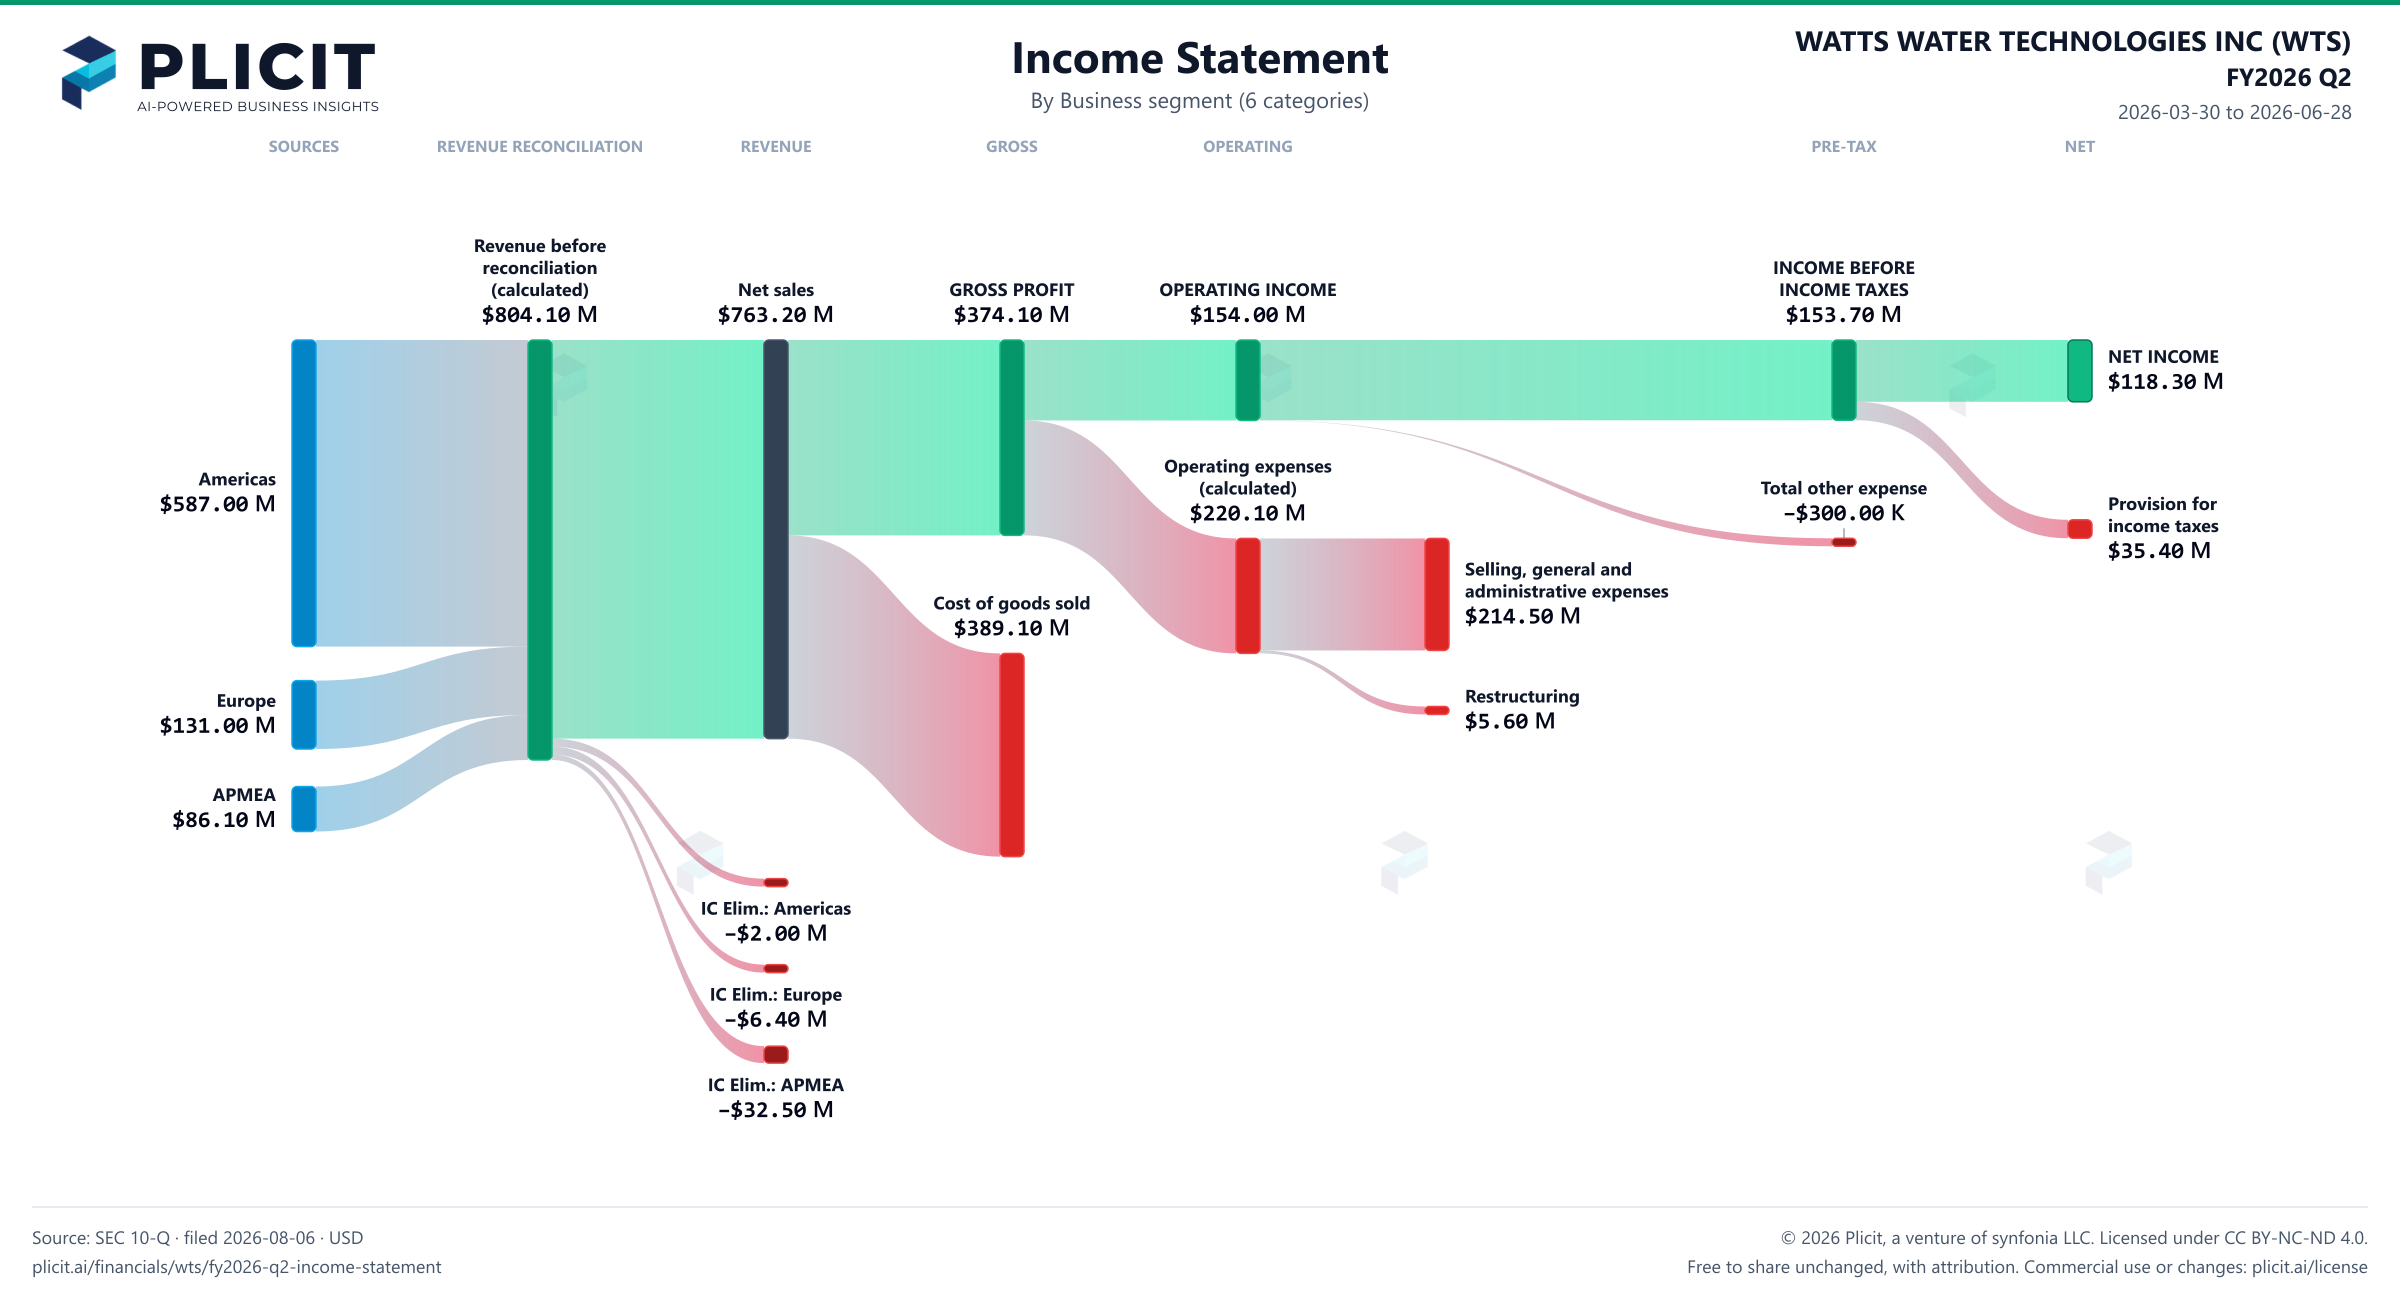
  • The three segments' bars add to $804.10 M, $40.90 M more than its $763.20 M in sales.
  • Americas is $587.00 M on this view, 73% of the segment total, against 77% of company sales.
  • Americas kept 26% of its sales as segment earnings, against 12% at APMEA.
  • Sales between segments total $40.90 M, and APMEA made $32.50 M of them.
  • Americas' growth slowed to 17% this quarter, from 23% in the first quarter.

The Unvarnished Truth

Watts Water's segments add to $804.10 M, but it sold $763.20 M

The segment bars add to more than the company's sales, and that is the first thing to notice. Watts Water's three segments show $804.10 M of net sales, yet consolidated sales were $763.20 M. The filing calls the gap an elimination, $40.90 M of sales made between its own units and counted twice before the company removed it. Most of that sits in APMEA, which sold $32.50 M to other parts of the group. Americas is still the largest part, at $587.00 M.

Costs tell a similar story. Cost of goods sold is the biggest cost in Americas, at $287.20 M, and in Europe, at $81.30 M, which is 62% of that segment's sales. The filing's note adds APMEA's cost of goods sold at $61.20 M. Americas keeps 26% of its sales as segment earnings, against 12% at APMEA, a gap the bars show at a glance. The segment figures include the internal sales, so APMEA's margin looks lower than it would on outside sales alone.

This view also hides how the growth was bought. Americas rose $86.50 M from a year earlier, and $28.40 M of that came from acquisitions completed in 2025, the filing says. That is the largest change of any segment. That leaves less organic growth than the headline suggests. Americas' acquired sales are the largest in the table. APMEA grew 31%, with $5.90 M acquired. Will the internal sales keep flowing through APMEA, and how much of that growth is real once the purchases are out?
Revenue by Business Segment (6 categories)

Swipe to see the full flow
WATTS WATER TECHNOLOGIES INC (WTS) FY2026 Q2 P&L / Income StatementIncome statement for 2026-03-30 through 2026-06-28. View: Business segment (6 categories). Revenue uses this breakdown; costs and expenses retain the consolidated categories.SOURCESREVENUE RECONCILIATIONREVENUEGROSSOPERATINGPRE-TAXNETAmericasEuropeAsia Pacific Middle East And Africa SegmentNet salesRevenue before reconciliation (calculated)Americas - Intersegment salesEurope - Intersegment salesAsia Pacific Middle East And Africa Segment - Intersegment salesGROSS PROFITCost of goods soldOPERATING INCOMEOperating expenses (calculated)Selling, general and administrative expensesRestructuringINCOME BEFORE INCOME TAXESTotal other expenseNET INCOMEProvision for income taxesRevenue before reconciliation (calculated)Revenue beforereconciliation(calculated)$804.10 MINCOME BEFORE INCOME TAXESINCOME BEFOREINCOME TAXES$153.70 MNet salesNet sales$763.20 MGROSS PROFITGROSS PROFIT$374.10 MOPERATING INCOMEOPERATING INCOME$154.00 MNET INCOMENET INCOME$118.30 MOperating expenses (calculated)Operating expenses(calculated)$220.10 MAmericasAmericas$587.00 MProvision for income taxesProvision forincome taxes$35.40 MTotal other expenseTotal other expense−$300.00 KSelling, general and administrative expensesSelling, general andadministrative expenses$214.50 MCost of goods soldCost of goods sold$389.10 MRestructuringRestructuring$5.60 MEuropeEurope$131.00 MAsia Pacific Middle East And Africa SegmentAPMEA$86.10 MAmericas - Intersegment salesIC Elim.: Americas−$2.00 MEurope - Intersegment salesIC Elim.: Europe−$6.40 MAsia Pacific Middle East And Africa Segment - Intersegment salesIC Elim.: APMEA−$32.50 M
Chart details

WATTS WATER TECHNOLOGIES INC (WTS) FY2026 Q2 P&L / Income Statement

Income statement for 2026-03-30 through 2026-06-28. View: Business segment (6 categories). Revenue uses this breakdown; costs and expenses retain the consolidated categories.

Net sales
763,200,000 US dollars
Cost of goods sold
389,100,000 US dollars
GROSS PROFIT
374,100,000 US dollars
Operating expenses (calculated)
220,100,000 US dollars
OPERATING INCOME
154,000,000 US dollars
Total other expense
negative 300,000 US dollars
INCOME BEFORE INCOME TAXES
153,700,000 US dollars
Provision for income taxes
35,400,000 US dollars
NET INCOME
118,300,000 US dollars
Americas
587,000,000 US dollars
Europe
131,000,000 US dollars
Asia Pacific Middle East And Africa Segment
86,100,000 US dollars
Selling, general and administrative expenses
214,500,000 US dollars
Restructuring
5,600,000 US dollars
Revenue before reconciliation (calculated)
804,100,000 US dollars. Sum of the reported revenue categories before the separately reported reconciliation.
Americas - Intersegment sales
negative 2,000,000 US dollars. Reported reconciliation to consolidated revenue.
Europe - Intersegment sales
negative 6,400,000 US dollars. Reported reconciliation to consolidated revenue.
Asia Pacific Middle East And Africa Segment - Intersegment sales
negative 32,500,000 US dollars. Reported reconciliation to consolidated revenue.
Americas costs (calculated)
436,900,000 US dollars. Segment revenue less segment operating income; it includes cost of revenue and operating expenses.
Europe costs (calculated)
114,400,000 US dollars. Segment revenue less segment operating income; it includes cost of revenue and operating expenses.
Asia Pacific Middle East And Africa Segment costs (calculated)
75,500,000 US dollars. Segment revenue less segment operating income; it includes cost of revenue and operating expenses.
Reconciling items (calculated)
negative 17,600,000 US dollars. Segment revenue less segment operating income; it includes cost of revenue and operating expenses.

Chart connections

  • Revenue less cost of revenue equals gross profit; gross profit less operating expenses equals operating income.
  • Operating income plus other income or expense equals income before tax. Income before tax less income tax expense or benefit equals net income.
  • Reported revenue categories plus the separately reported signed reconciliation equals consolidated revenue.
WATTS WATER TECHNOLOGIES INC (WTS) FY2026 Q2 Revenue by Business Segment (6 categories) Sankey chart
Free to share unchanged, with credit to Plicit.ai · CC BY-NC-ND 4.0Download PNG

Intelligent Insights for Investors

Which of Watts Water's businesses brings in the most sales?

Americas is the biggest business by a wide margin: $587.00 M of the $763.20 M total this quarter. Europe is a distant second at $131.00 M.

How profitable is each of Watts Water's businesses?

Americas is the most profitable: it kept 26% of its sales as segment earnings this quarter, against 12% at APMEA. Its $150.10 M of segment earnings is 85% of the $177.30 M all three segments earned.

How much do head-office costs take out of Watts Water's business profits?

About 13% of segment earnings never reached operating income, so corporate costs and special items took $23.30 M this quarter.

Which of Watts Water's businesses drove its profit change over the past year?

Most of the gain came from one place: Americas added $14.30 M this quarter, out of $22.00 M for all its businesses together.

Intelligent Insights for Suppliers

How much does Watts Water depend on the biggest piece of its sales by business?

Heavily: Americas brought in 73% of these sales this quarter, against 16% for Europe, the next largest.

What are the biggest costs inside each of Watts Water's businesses?

For both Americas and Europe, cost of goods sold is the largest cost this quarter: 49% of sales in the first, 62% in the second. Comparing the two shows which business spends more of each dollar on it.

Product waitlist

Health Check and Teardown for your own company

A health check uncovers insights of your private books, not a public ticker. Join this list to get notified as soon as we go-live!