
WATTS WATER TECHNOLOGIES INC (WTS) FY2026 Q2 P&L / Income Statement

Published · Updated Source: Form 10-Q on SEC EDGAR filed (opens in a new tab)

Key Takeaways

  • Americas brought in $585.00 M of the $763.20 M total, 77% of sales this quarter.
  • Outside Americas, Europe and APMEA together made $178.20 M, 23% of sales.
  • Currency added $6.50 M to sales this quarter, 0.9% of the total, $3.40 M of it in Europe.
  • Americas holds 69% of property and equipment but brings in 77% of sales.
  • Europe grew 12%, the slowest of the three regions, against 19% for the whole.

The Unvarnished Truth

Americas supplies 77% of sales, and a weaker dollar padded the rest

Americas is the company in sales terms. It brought in $585.00 M of $763.20 M, 77% of the total. The U.S. alone booked $553.40 M, 73% of everything Watts Water sold. Europe and APMEA made the rest, $178.20 M between them. The rest of Americas, outside the U.S., came to $31.60 M, so the U.S. is the core of the business. Currency helped that remainder: the filing's table shows $3.40 M of currency in Europe and $3.00 M in APMEA.

Property tells a different story. Americas holds $203.10 M of the $295.50 M of property and equipment, 69% of it, against its 77% of sales. Americas' property share is lower than its sales share, so the factory base is spread wider than the sales base. The filing sets the rule: sales by region are based upon "location of the entity recording the sale," so a sale booked in one country counts there even if the buyer is elsewhere. Property sits mostly in Americas, the same region as most sales.

Europe grew the slowest of the three regions, at 12%, against 19% for the whole. Its $13.60 M rise included $3.40 M of currency, and organic growth there was 9.2%. The filing's own figures split it: Europe added $10.20 M organically, $3.40 M from currency, and nothing from acquisitions. APMEA, by contrast, grew 57%, with $5.90 M of that from an acquisition. Europe's currency gain was a small part of its growth. Will the weaker dollar keep helping, or was Europe's gain mostly price and volume?
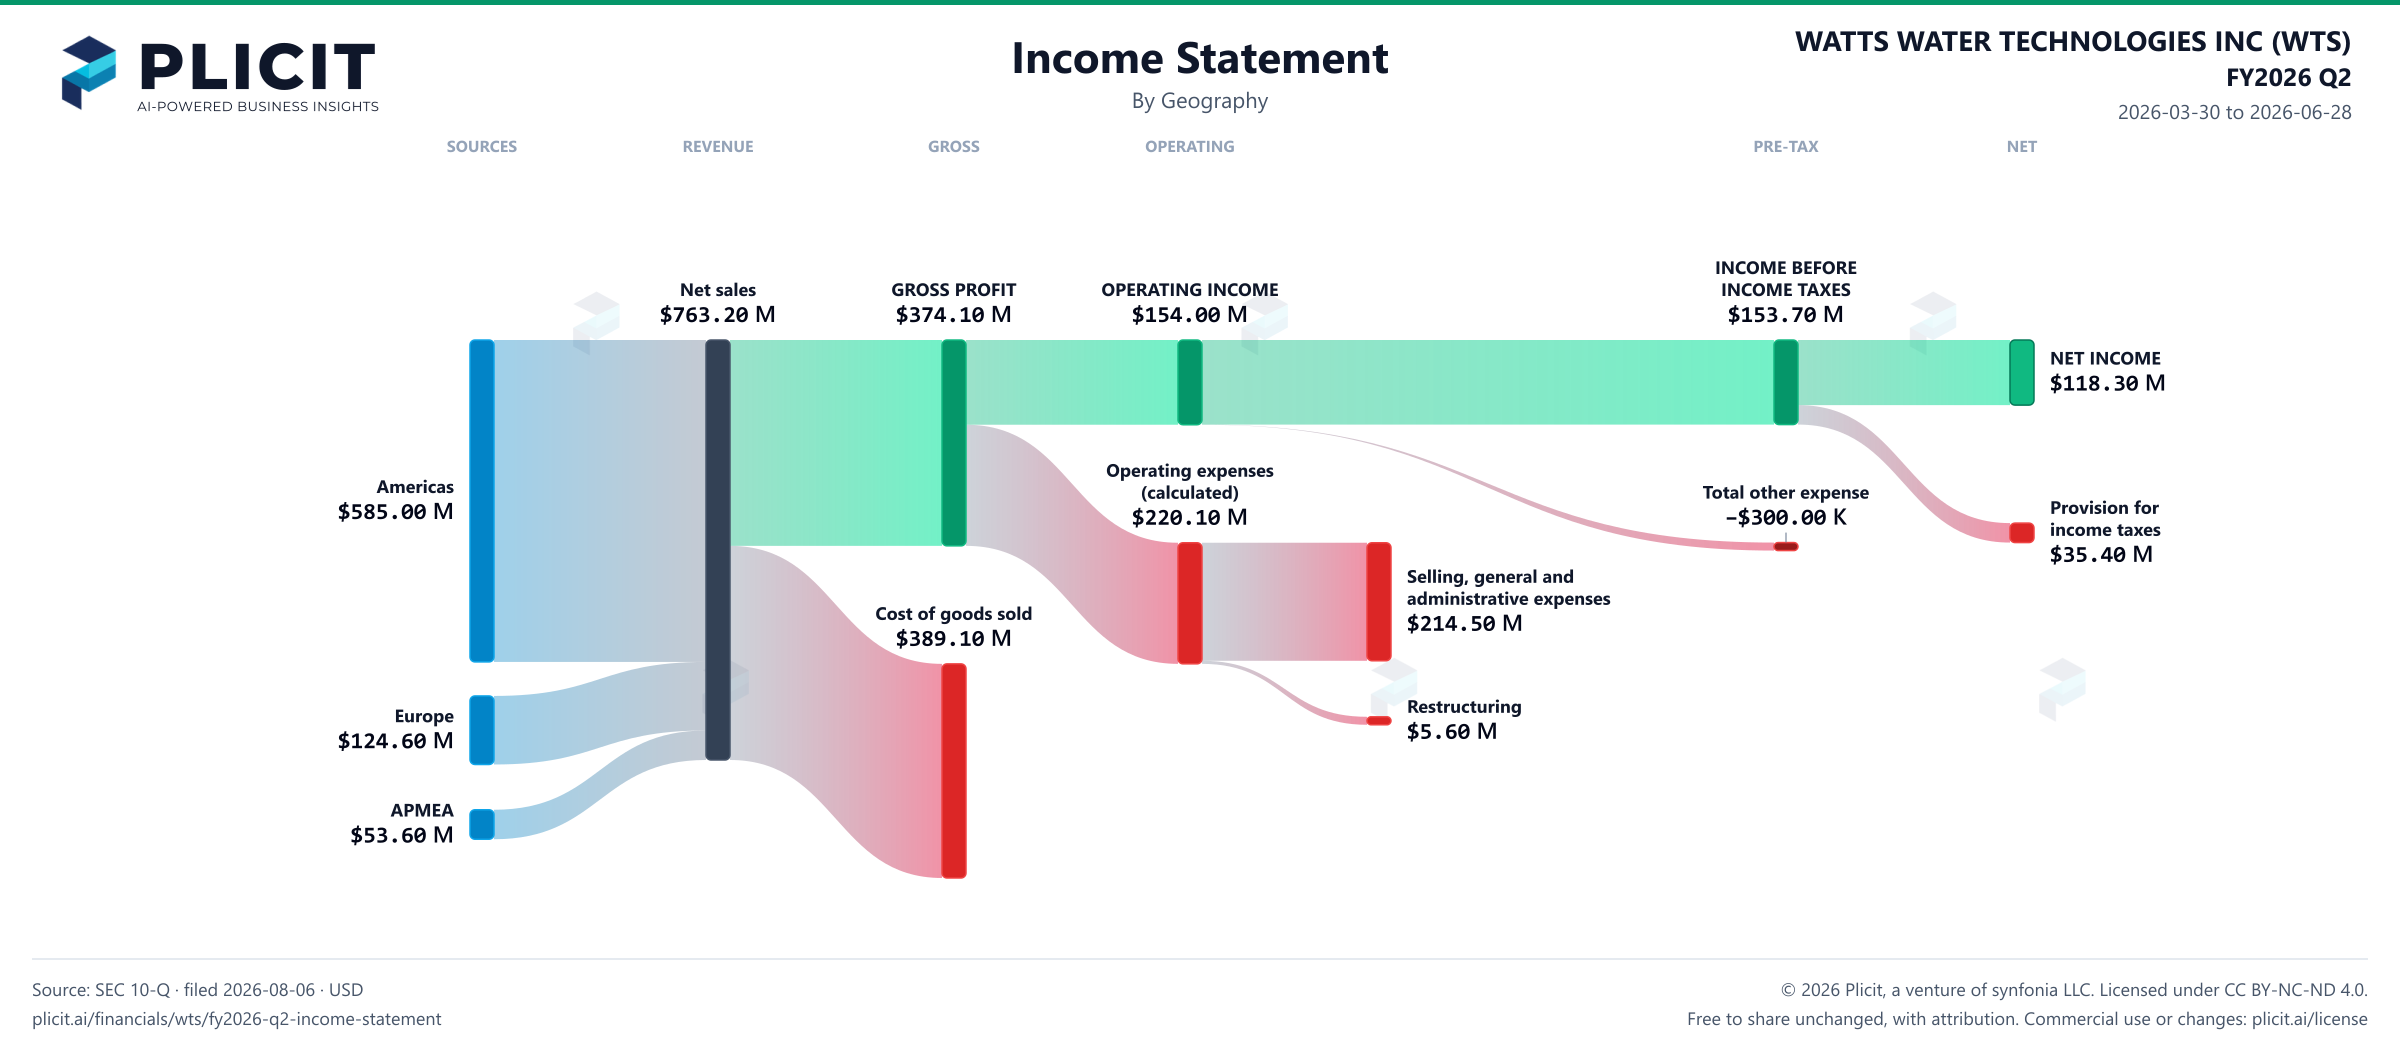
Revenue by Geography

Swipe to see the full flow
WATTS WATER TECHNOLOGIES INC (WTS) FY2026 Q2 P&L / Income StatementIncome statement for 2026-03-30 through 2026-06-28. View: Geography. Revenue uses this breakdown; costs and expenses retain the consolidated categories.SOURCESREVENUEGROSSOPERATINGPRE-TAXNETAmericasEuropeAPMEANet salesGROSS PROFITCost of goods soldOPERATING INCOMEOperating expenses (calculated)Selling, general and administrative expensesRestructuringINCOME BEFORE INCOME TAXESTotal other expenseNET INCOMEProvision for income taxesINCOME BEFORE INCOME TAXESINCOME BEFOREINCOME TAXES$153.70 MNet salesNet sales$763.20 MGROSS PROFITGROSS PROFIT$374.10 MOPERATING INCOMEOPERATING INCOME$154.00 MNET INCOMENET INCOME$118.30 MOperating expenses (calculated)Operating expenses(calculated)$220.10 MAmericasAmericas$585.00 MProvision for income taxesProvision forincome taxes$35.40 MTotal other expenseTotal other expense−$300.00 KSelling, general and administrative expensesSelling, general andadministrative expenses$214.50 MCost of goods soldCost of goods sold$389.10 MRestructuringRestructuring$5.60 MEuropeEurope$124.60 MAPMEAAPMEA$53.60 M
Chart details

WATTS WATER TECHNOLOGIES INC (WTS) FY2026 Q2 P&L / Income Statement

Income statement for 2026-03-30 through 2026-06-28. View: Geography. Revenue uses this breakdown; costs and expenses retain the consolidated categories.

Net sales
763,200,000 US dollars
Cost of goods sold
389,100,000 US dollars
GROSS PROFIT
374,100,000 US dollars
Operating expenses (calculated)
220,100,000 US dollars
OPERATING INCOME
154,000,000 US dollars
Total other expense
negative 300,000 US dollars
INCOME BEFORE INCOME TAXES
153,700,000 US dollars
Provision for income taxes
35,400,000 US dollars
NET INCOME
118,300,000 US dollars
Americas
585,000,000 US dollars
Europe
124,600,000 US dollars
APMEA
53,600,000 US dollars
Selling, general and administrative expenses
214,500,000 US dollars
Restructuring
5,600,000 US dollars

Chart connections

  • Revenue less cost of revenue equals gross profit; gross profit less operating expenses equals operating income.
  • Operating income plus other income or expense equals income before tax. Income before tax less income tax expense or benefit equals net income.
WATTS WATER TECHNOLOGIES INC (WTS) FY2026 Q2 Revenue by Geography Sankey chart
Free to share unchanged, with credit to Plicit.ai · CC BY-NC-ND 4.0Download PNG

Intelligent Insights for Investors

Where in the world does Watts Water make its sales?

Its biggest market is Americas, with $585.00 M of $763.20 M in sales this quarter. Europe is the runner-up, at $124.60 M.

How much did currency swings change Watts Water's reported sales?

Currency added $6.50 M to Watts Water's sales this quarter, 0.9% of the total. Europe took $3.40 M of it and APMEA $3.00 M.

Does Watts Water assign sales by region using customers, delivery locations or operating locations?

Watts Water books a sale where the selling entity is located. The filing says sales by region are based on the location of the entity recording the sale.

Where are Watts Water's factories, offices and other long-term assets located?

Americas holds 69% of Watts Water's property and equipment but brings in 77% of its sales this quarter. Its property sits mostly where its sales are, though not in the same proportion.

Intelligent Insights for Employees

Which part of Watts Water's sales by region grew fastest over the past year?

APMEA grew fastest, by 57% from a year earlier, outpacing the 19% growth of the whole. A part growing faster than the total takes a bigger slice of the mix.

Intelligent Insights for Suppliers

How much does Watts Water depend on the biggest piece of its sales by region?

Heavily: Americas brought in 77% of these sales this quarter, against 16% for Europe, the next largest.

Product waitlist

Health Check and Teardown for your own company

A health check uncovers insights of your private books, not a public ticker. Join this list to get notified as soon as we go-live!