
THE GREENBRIER COMPANIES, INC. (GBX) FY2026 Annual P&L / Income Statement

Published · Updated Source: Form 10-K on SEC EDGAR filed (opens in a new tab)

Key Takeaways

  • US sales fell to $1.83 B from $2.43 B, accounting for 78% of a $779.10 M revenue drop.
  • Sales outside the United States were $633.90 M, 26% of the total, against 25% a year earlier.
  • Operations abroad earned 57% of pretax income while bringing in only 26% of sales.
  • Foreign sales also fell, to $633.90 M from $808.90 M, so the slump was not only American.

The Unvarnished Truth

US sales sank 25% and drove most of the Greenbrier slump

Greenbrier sales fell $779.10 M in the year to August 31, 2026, and the United States carried most of the damage. American sales sank 25% to $1.83 B from $2.43 B, accounting for 78% of the decline. Sales abroad fell too, to $633.90 M from $808.90 M, but more gently, so their share of revenue edged up to 26% from 25%. Management ties the drop to "a 31.9% decrease in deliveries partially offset by a change in railcar manufacturing product mix." The home market is where the order drought hit hardest.

Here is the twist. Operations outside the United States earned $44.80 M of pretax income, 57% of the total, on 26% of sales, while domestic operations earned only $33.80 M. Why would the smaller market earn more? Part of the answer may lie in Mexico: management says its tax rate is shaped by "the proportion of earnings attributable to our Mexican railcar manufacturing joint venture." Sales and pretax income are split on different bases, so the maps never match exactly, but a gap this wide suggests much of the margin is made outside the home market.

For investors, the American rail market is the swing factor: it still supplies 74% of sales, and it has kept shrinking, to $1.83 B this year from $2.43 B last year and $2.79 B the year before. Currency also helped: management credits part of a $10.7 million drop in interest and foreign exchange expense to the Mexican Peso and Brazilian Real. Watch US orders and the split of profit between home and abroad. If American demand stays weak, can the operations abroad keep earning the bigger share of pretax income, or will they slide with it?
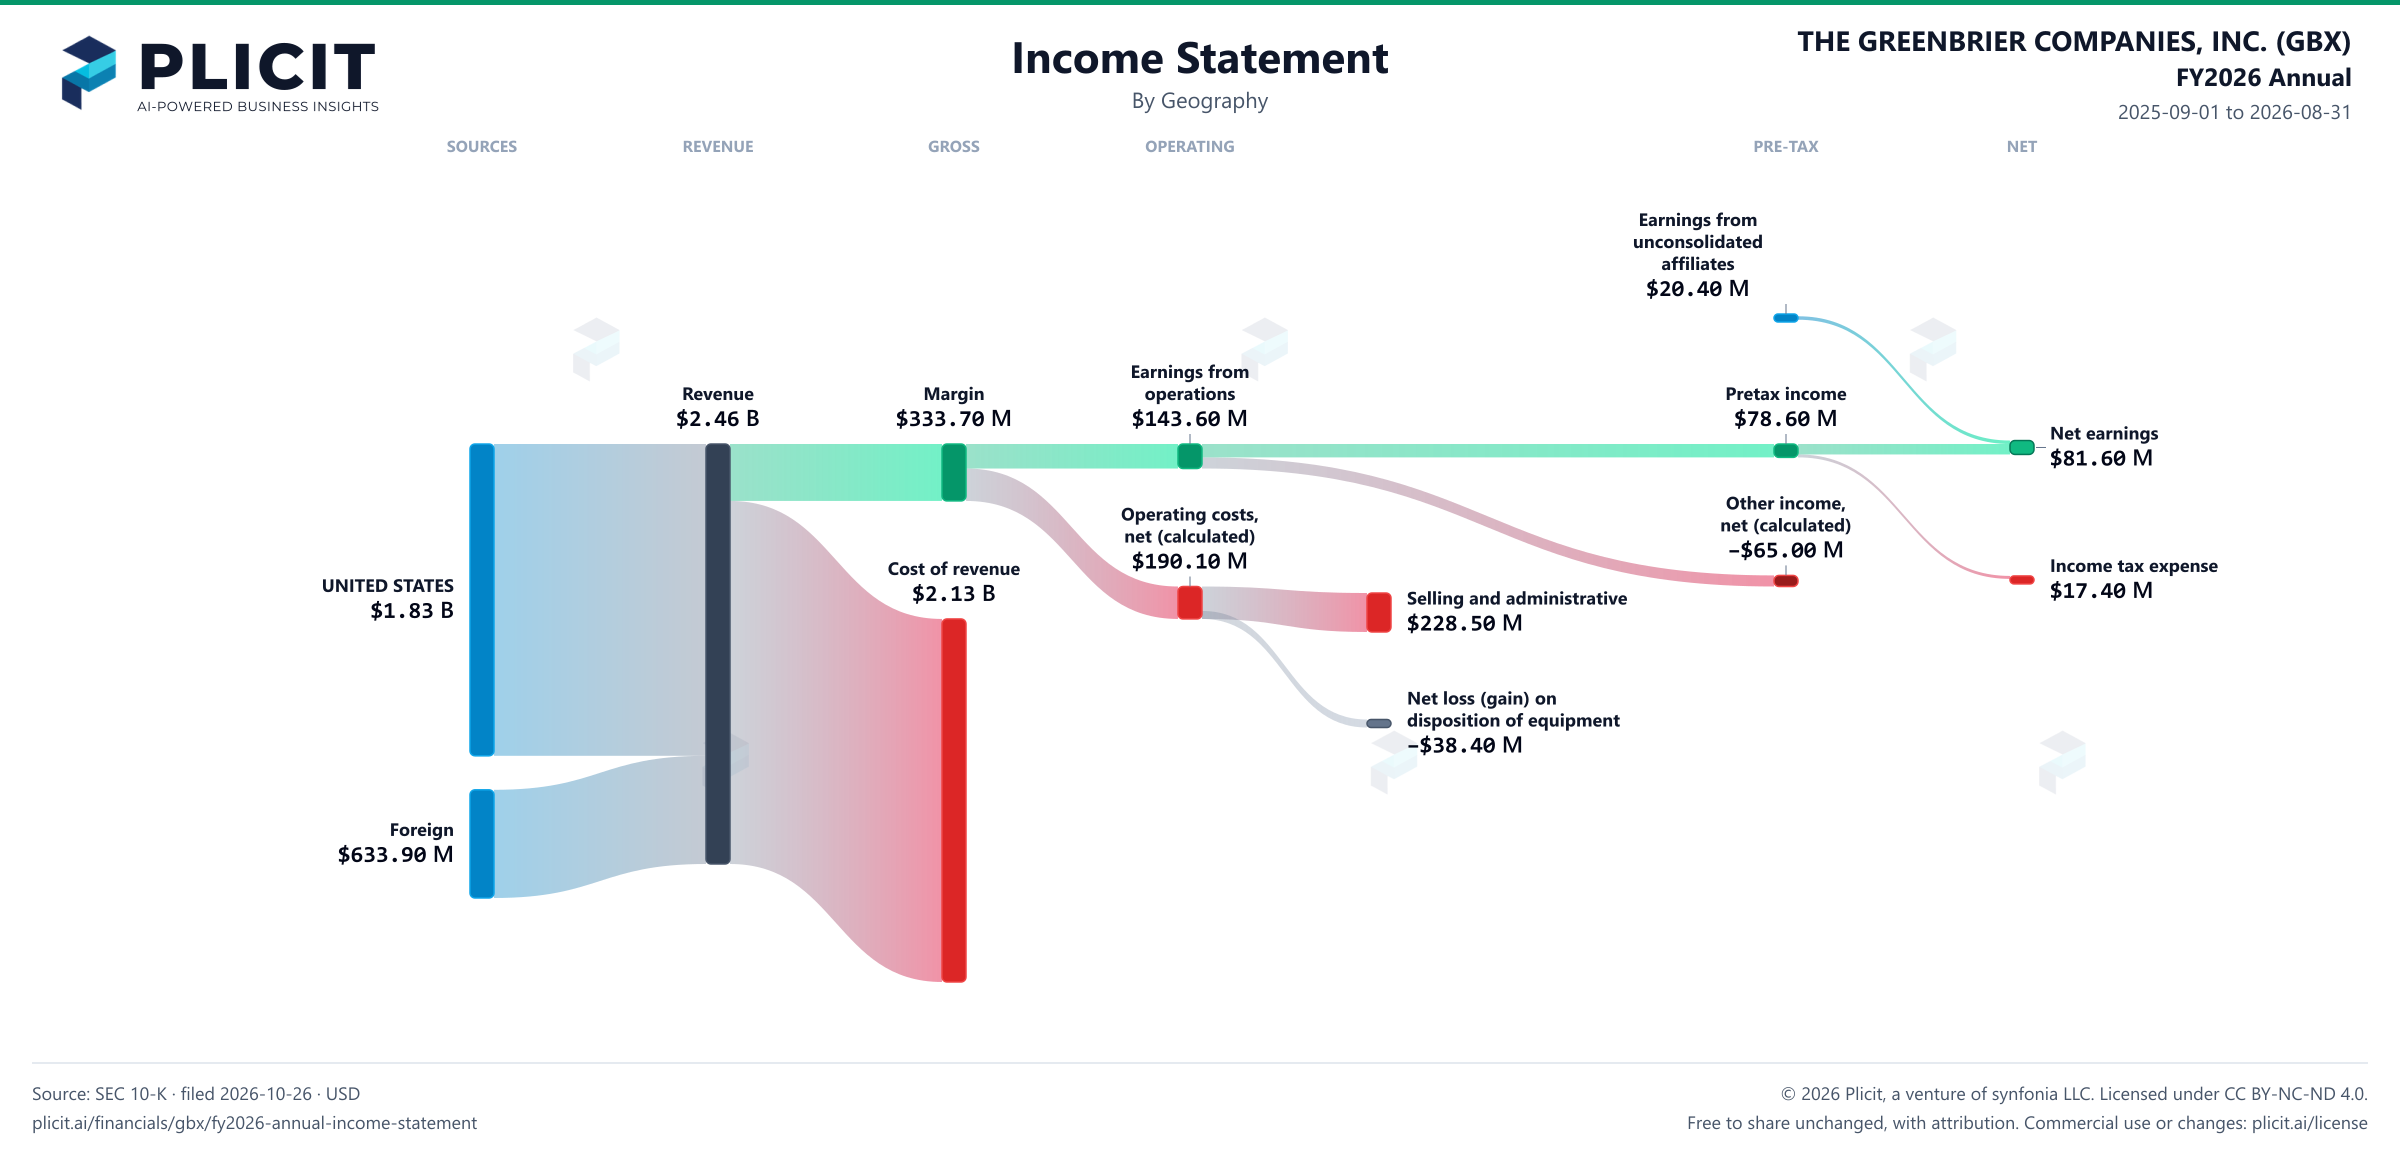
Revenue by Geography

Swipe to see the full flow
THE GREENBRIER COMPANIES, INC. (GBX) FY2026 Annual P&L / Income StatementIncome statement for 2025-09-01 through 2026-08-31. View: Geography. Revenue uses this breakdown; costs and expenses retain the consolidated categories.SOURCESREVENUEGROSSOPERATINGPRE-TAXNETUNITED STATESForeignRevenueMarginCost of revenueEarnings from operationsOperating costs, net of other operating income (calculated)Selling and administrativeNet loss (gain) on disposition of equipmentEarnings before income tax and earnings from unconsolidated affiliatesOther income (expense), net (calculated)Net earningsIncome tax expenseEarnings from unconsolidated affiliatesEarnings from unconsolidated affiliatesEarnings fromunconsolidatedaffiliates$20.40 MEarnings from operationsEarnings fromoperations$143.60 MRevenueRevenue$2.46 BMarginMargin$333.70 MEarnings before income tax and earnings from unconsolidated affiliatesPretax income$78.60 MNet earningsNet earnings$81.60 MOperating costs, net of other operating income (calculated)Operating costs,net (calculated)$190.10 MIncome tax expenseIncome tax expense$17.40 MCost of revenueCost of revenue$2.13 BUNITED STATESUNITED STATES$1.83 BSelling and administrativeSelling and administrative$228.50 MOther income (expense), net (calculated)Other income,net (calculated)−$65.00 MNet loss (gain) on disposition of equipmentNet loss (gain) ondisposition of equipment−$38.40 MForeignForeign$633.90 M
Chart details

THE GREENBRIER COMPANIES, INC. (GBX) FY2026 Annual P&L / Income Statement

Income statement for 2025-09-01 through 2026-08-31. View: Geography. Revenue uses this breakdown; costs and expenses retain the consolidated categories.

Revenue
2,461,100,000 US dollars
Cost of revenue
2,127,400,000 US dollars
Margin
333,700,000 US dollars
Operating costs, net of other operating income (calculated)
190,100,000 US dollars
Earnings from operations
143,600,000 US dollars
Other income (expense), net (calculated)
negative 65,000,000 US dollars
Earnings before income tax and earnings from unconsolidated affiliates
78,600,000 US dollars
Income tax expense
17,400,000 US dollars
Net earnings
81,600,000 US dollars
UNITED STATES
1,827,200,000 US dollars
Foreign
633,900,000 US dollars
Selling and administrative
228,500,000 US dollars
Net loss (gain) on disposition of equipment
negative 38,400,000 US dollars
Earnings from unconsolidated affiliates
20,400,000 US dollars. Reported below-tax contribution to net income.

Chart connections

  • Revenue less cost of revenue equals gross profit; gross profit less operating expenses equals operating income.
  • Operating income plus other income or expense equals income before tax. Income before tax less income tax expense or benefit, plus the explicitly reported below-tax contributions, equals net income.
  • Of which attributable to THE GREENBRIER COMPANIES, INC.: $79.00 M; to noncontrolling interests: $2.60 M.
THE GREENBRIER COMPANIES, INC. (GBX) FY2026 Annual Revenue by Geography Sankey chart
Free to share unchanged, with credit to Plicit.ai · CC BY-NC-ND 4.0Download PNG

Intelligent Insights for Investors

Where in the world does Greenbrier make its sales?

Its biggest market is the United States, with $1.83 B of $2.46 B in sales this year; foreign markets came next.

How much of Greenbrier sales come from outside its home country?

$633.90 M, or 26% of sales this year, came from outside the United States. Exchange-rate swings can nudge those totals, since sales abroad are often earned in other currencies.

Are Greenbrier operations abroad more or less profitable than its domestic business?

More profitable abroad: operations outside the United States earned 57% of pretax income this year from 26% of sales. Sales and income are split on different bases, so the match is not exact.

Intelligent Insights for Everyone

Which regions drove the change in Greenbrier sales over the past year?

Mostly the United States: it lost $604.10 M of the $779.10 M fall in revenue from a year earlier.

Product waitlist

Health Check and Teardown for your own company

A health check uncovers insights of your private books, not a public ticker. Join this list to get notified as soon as we go-live!