
MORNINGSTAR, INC. (MORN) FY2026 Q3 P&L / Income Statement

Published · Updated Source: Form 10-Q on SEC EDGAR filed (opens in a new tab)

Key Takeaways

  • Net income was $115.50 M this quarter, up 26% from $91.60 M a year earlier.
  • Operating income rose 31% to $167.40 M, but net interest cost rose 151% to $17.60 M.
  • Gross margin reached 64.2%, up 3.3 points, so more of each sale is kept.
  • Operating profit covered net interest 9.5 times, down from 18.3 times a year earlier.

The Unvarnished Truth

Profit rose 26%, but interest cost more than doubled

Net income rose 26%, to $115.50 M, and operating income climbed 31% to $167.40 M. The cost that grew fastest was interest: net interest expense went from $7.00 M to $17.60 M, more than doubling in a year. The company's own table shows gross interest expense rising from $9.40 M to $20.00 M over the same quarter. The filing says interest expense mainly relates to the outstanding balances under its credit agreements and notes. Income before income taxes came to $152.40 M, after $15.00 M of net non-operating expense.

Operating profit grew with revenue, which rose 9% to $672.10 M. Cost of revenue, the direct cost of what it sold, still took $240.70 M, or about $35.81 of every $100 of sales. Gross margin widened by 3.3 points to 64.2%, so cost of revenue per sale fell. Selling and overhead costs fell as a share of sales, from 32.6% to 31.4%. Operating margin rose to 24.9% of sales, against 20.7% a year earlier. Diluted earnings per share were $3.06, only 1.0% below the basic $3.09.

For a reader, profit is real, but net interest took 11% of operating profit, against 5% a year earlier. Whether that interest load keeps climbing depends on how the company refinances and repays its $1.68 B of debt. Part of that debt floats with rates: a 100 basis-point rise in SOFR would add $13.30 M a year to interest, the filing estimates. Will the rising interest bill absorb the margin gains, or will the company pay down its $1.68 B before the next quarter?
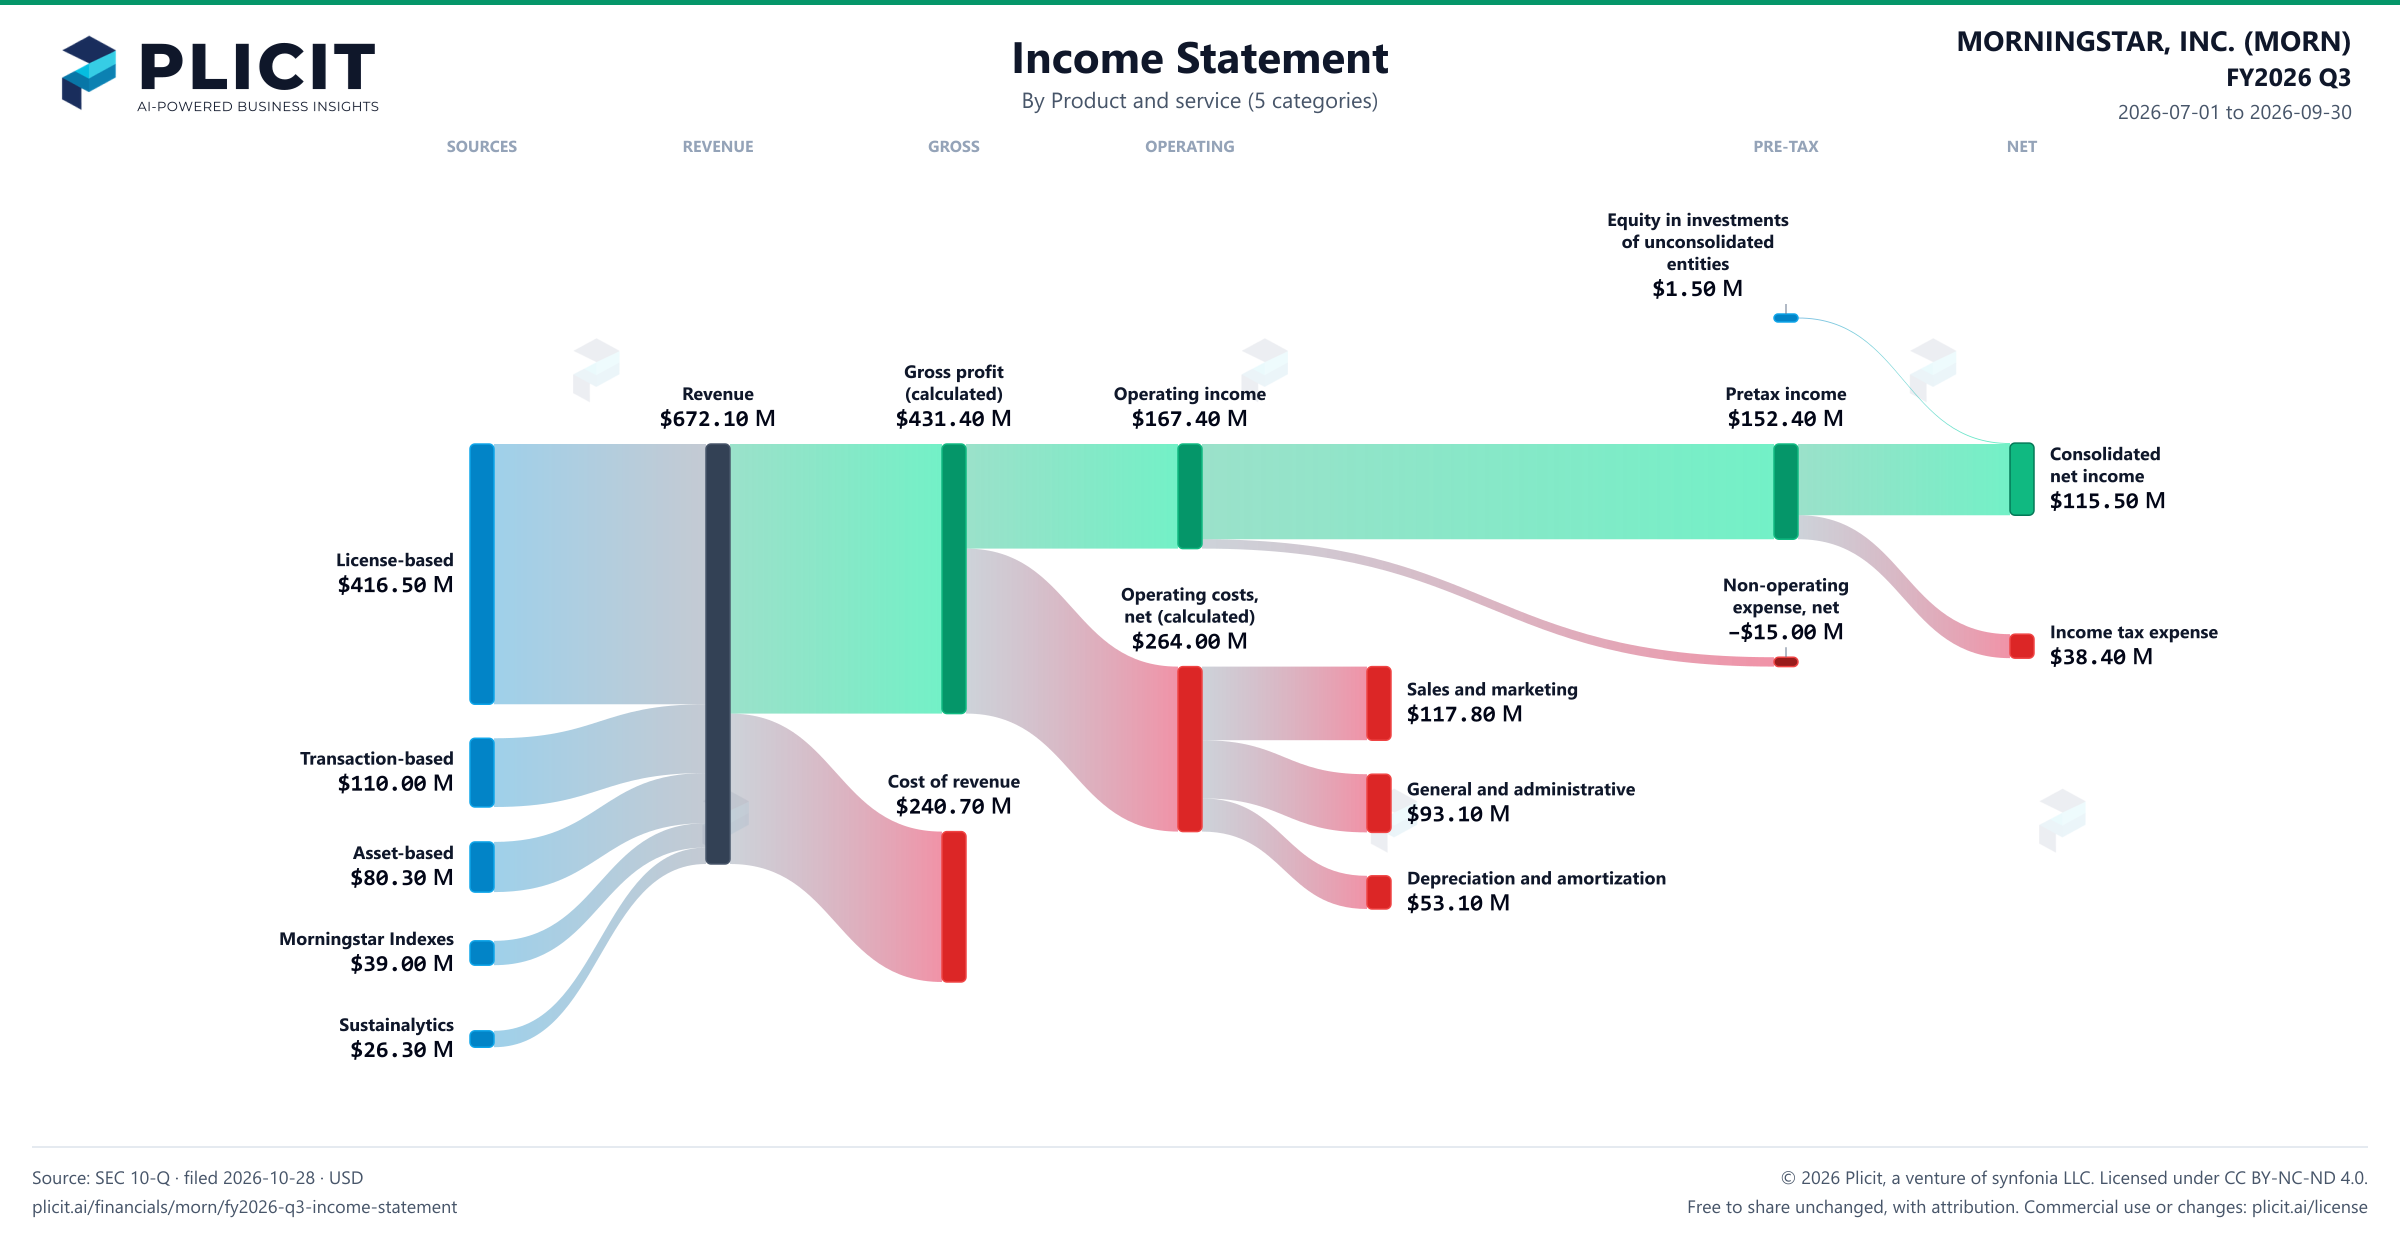
Revenue by Product and Service (5 categories)

Swipe to see the full flow
MORNINGSTAR, INC. (MORN) FY2026 Q3 P&L / Income StatementIncome statement for 2026-07-01 through 2026-09-30. View: Product and service (5 categories). Revenue uses this breakdown; costs and expenses retain the consolidated categories.SOURCESREVENUEGROSSOPERATINGPRE-TAXNETLicense-basedTransaction-basedAsset-basedMorningstar IndexesSustainalyticsRevenueGross profit (calculated)Cost of revenueOperating incomeOperating costs, net of other operating income (calculated)Sales and marketingGeneral and administrativeDepreciation and amortizationIncome before income taxes and equity in investments of unconsolidated entitiesNon-operating expense, netConsolidated net incomeIncome tax expenseEquity in investments of unconsolidated entitiesEquity in investments of unconsolidated entitiesEquity in investmentsof unconsolidatedentities$1.50 MGross profit (calculated)Gross profit(calculated)$431.40 MRevenueRevenue$672.10 MOperating incomeOperating income$167.40 MIncome before income taxes and equity in investments of unconsolidated entitiesPretax income$152.40 MConsolidated net incomeConsolidatednet income$115.50 MLicense-basedLicense-based$416.50 MOperating costs, net of other operating income (calculated)Operating costs,net (calculated)$264.00 MIncome tax expenseIncome tax expense$38.40 MNon-operating expense, netNon-operatingexpense, net−$15.00 MSales and marketingSales and marketing$117.80 MTransaction-basedTransaction-based$110.00 MCost of revenueCost of revenue$240.70 MGeneral and administrativeGeneral and administrative$93.10 MAsset-basedAsset-based$80.30 MDepreciation and amortizationDepreciation and amortization$53.10 MMorningstar IndexesMorningstar Indexes$39.00 MSustainalyticsSustainalytics$26.30 M
Chart details

MORNINGSTAR, INC. (MORN) FY2026 Q3 P&L / Income Statement

Income statement for 2026-07-01 through 2026-09-30. View: Product and service (5 categories). Revenue uses this breakdown; costs and expenses retain the consolidated categories.

Revenue
672,100,000 US dollars
Cost of revenue
240,700,000 US dollars
Gross profit (calculated)
431,400,000 US dollars
Operating costs, net of other operating income (calculated)
264,000,000 US dollars
Operating income
167,400,000 US dollars
Non-operating expense, net
negative 15,000,000 US dollars
Income before income taxes and equity in investments of unconsolidated entities
152,400,000 US dollars
Income tax expense
38,400,000 US dollars
Consolidated net income
115,500,000 US dollars
Sustainalytics
26,300,000 US dollars
Morningstar Indexes
39,000,000 US dollars
Asset-based
80,300,000 US dollars
License-based
416,500,000 US dollars
Transaction-based
110,000,000 US dollars
Sales and marketing
117,800,000 US dollars
General and administrative
93,100,000 US dollars
Depreciation and amortization
53,100,000 US dollars
Other operating income
0 US dollars
Equity in investments of unconsolidated entities
1,500,000 US dollars. Reported below-tax contribution to net income.

Chart connections

  • Revenue less cost of revenue equals gross profit; gross profit less operating expenses equals operating income.
  • Operating income plus other income or expense equals income before tax. Income before tax less income tax expense or benefit, plus the explicitly reported below-tax contributions, equals net income.
MORNINGSTAR, INC. (MORN) FY2026 Q3 P&L / Income Statement Sankey chart, Product and service (5 categories) view
Free to share unchanged, with credit to Plicit.ai · CC BY-NC-ND 4.0Download PNG

Intelligent Insights for Investors

Did Morningstar make a profit this period?

Yes, $115.50 M this quarter. Its net margin (the share of sales left as profit once every cost is counted) was 17%, the yardstick for comparing profit across companies of different sizes.

Intelligent Insights for Lenders

Does Morningstar earn enough to cover its interest payments?

Yes: its operating profit covered its net interest cost 9.5 times this quarter, against 18.3 times a year earlier.

Intelligent Insights for Employees

Are Morningstar's overhead and selling costs falling as a share of sales?

Yes: selling and overhead costs took 31.4% of sales this quarter, down from 32.6% a year earlier.

Product waitlist

Health Check and Teardown for your own company

A health check uncovers insights of your private books, not a public ticker. Join this list to get notified as soon as we go-live!