
MORNINGSTAR, INC. (MORN) FY2026 Q3 P&L / Income Statement

Published · Updated Source: Form 10-Q on SEC EDGAR filed (opens in a new tab)

Key Takeaways

  • Corporate and All Other rose 31% to $65.30 M, the fastest gain of any business line.
  • Indexes, which holds the acquired CRSP business, rose from $21.80 M to $39.00 M.
  • Wealth fell 4.3% to $59.40 M, the only one of six business lines to shrink.
  • PitchBook carries 36% of the $1.75 B of goodwill from past acquisitions.

The Unvarnished Truth

Corporate and All Other rose 31%, led by its index unit

Corporate and All Other rose 30.9% to $65.30 M, from $49.90 M a year earlier, the fastest climb of any line in this view. Inside it, Morningstar Indexes went from $21.80 M to $39.00 M, and the filing says CRSP sits in that same operating segment. Indexes alone added $17.20 M, more than the $15.40 M rise in the whole line. Organic growth, which strips out CRSP and currency, was only 11.8% for Indexes, so most of its rise was bought rather than earned. Its other unit, Sustainalytics, slipped from $28.10 M to $26.30 M.

PitchBook, the second-largest line at $175.60 M, grew only 3.9%, while the whole company's sales rose 8.9%. Morningstar Wealth fell 4.3% to $59.40 M, and its license revenue dropped 26.2%. The sunsetting of Morningstar Office explains much of that: excluding it, organic revenue would have increased 2.1%. Morningstar Credit grew 18.3%, adding $16.70 M, and the filing ties that gain to a robust issuance market. Morningstar Retirement rose 21.3% to $41.50 M. The Direct Platform line grew 5.4% to $222.50 M, slower than the 8.9% for the whole company.

For a reader, the segment view says where the money is made and where it was bought, which is a different question. PitchBook carries 36% of the $1.75 B of goodwill from past acquisitions. That goodwill is an accounting asset, and it is only as good as the earnings it is expected to produce. A write-down would shrink it at once, so the question is whether those lines keep earning enough to justify the price. Which of these lines grows on its own, and how much of the fastest riser was simply bought?
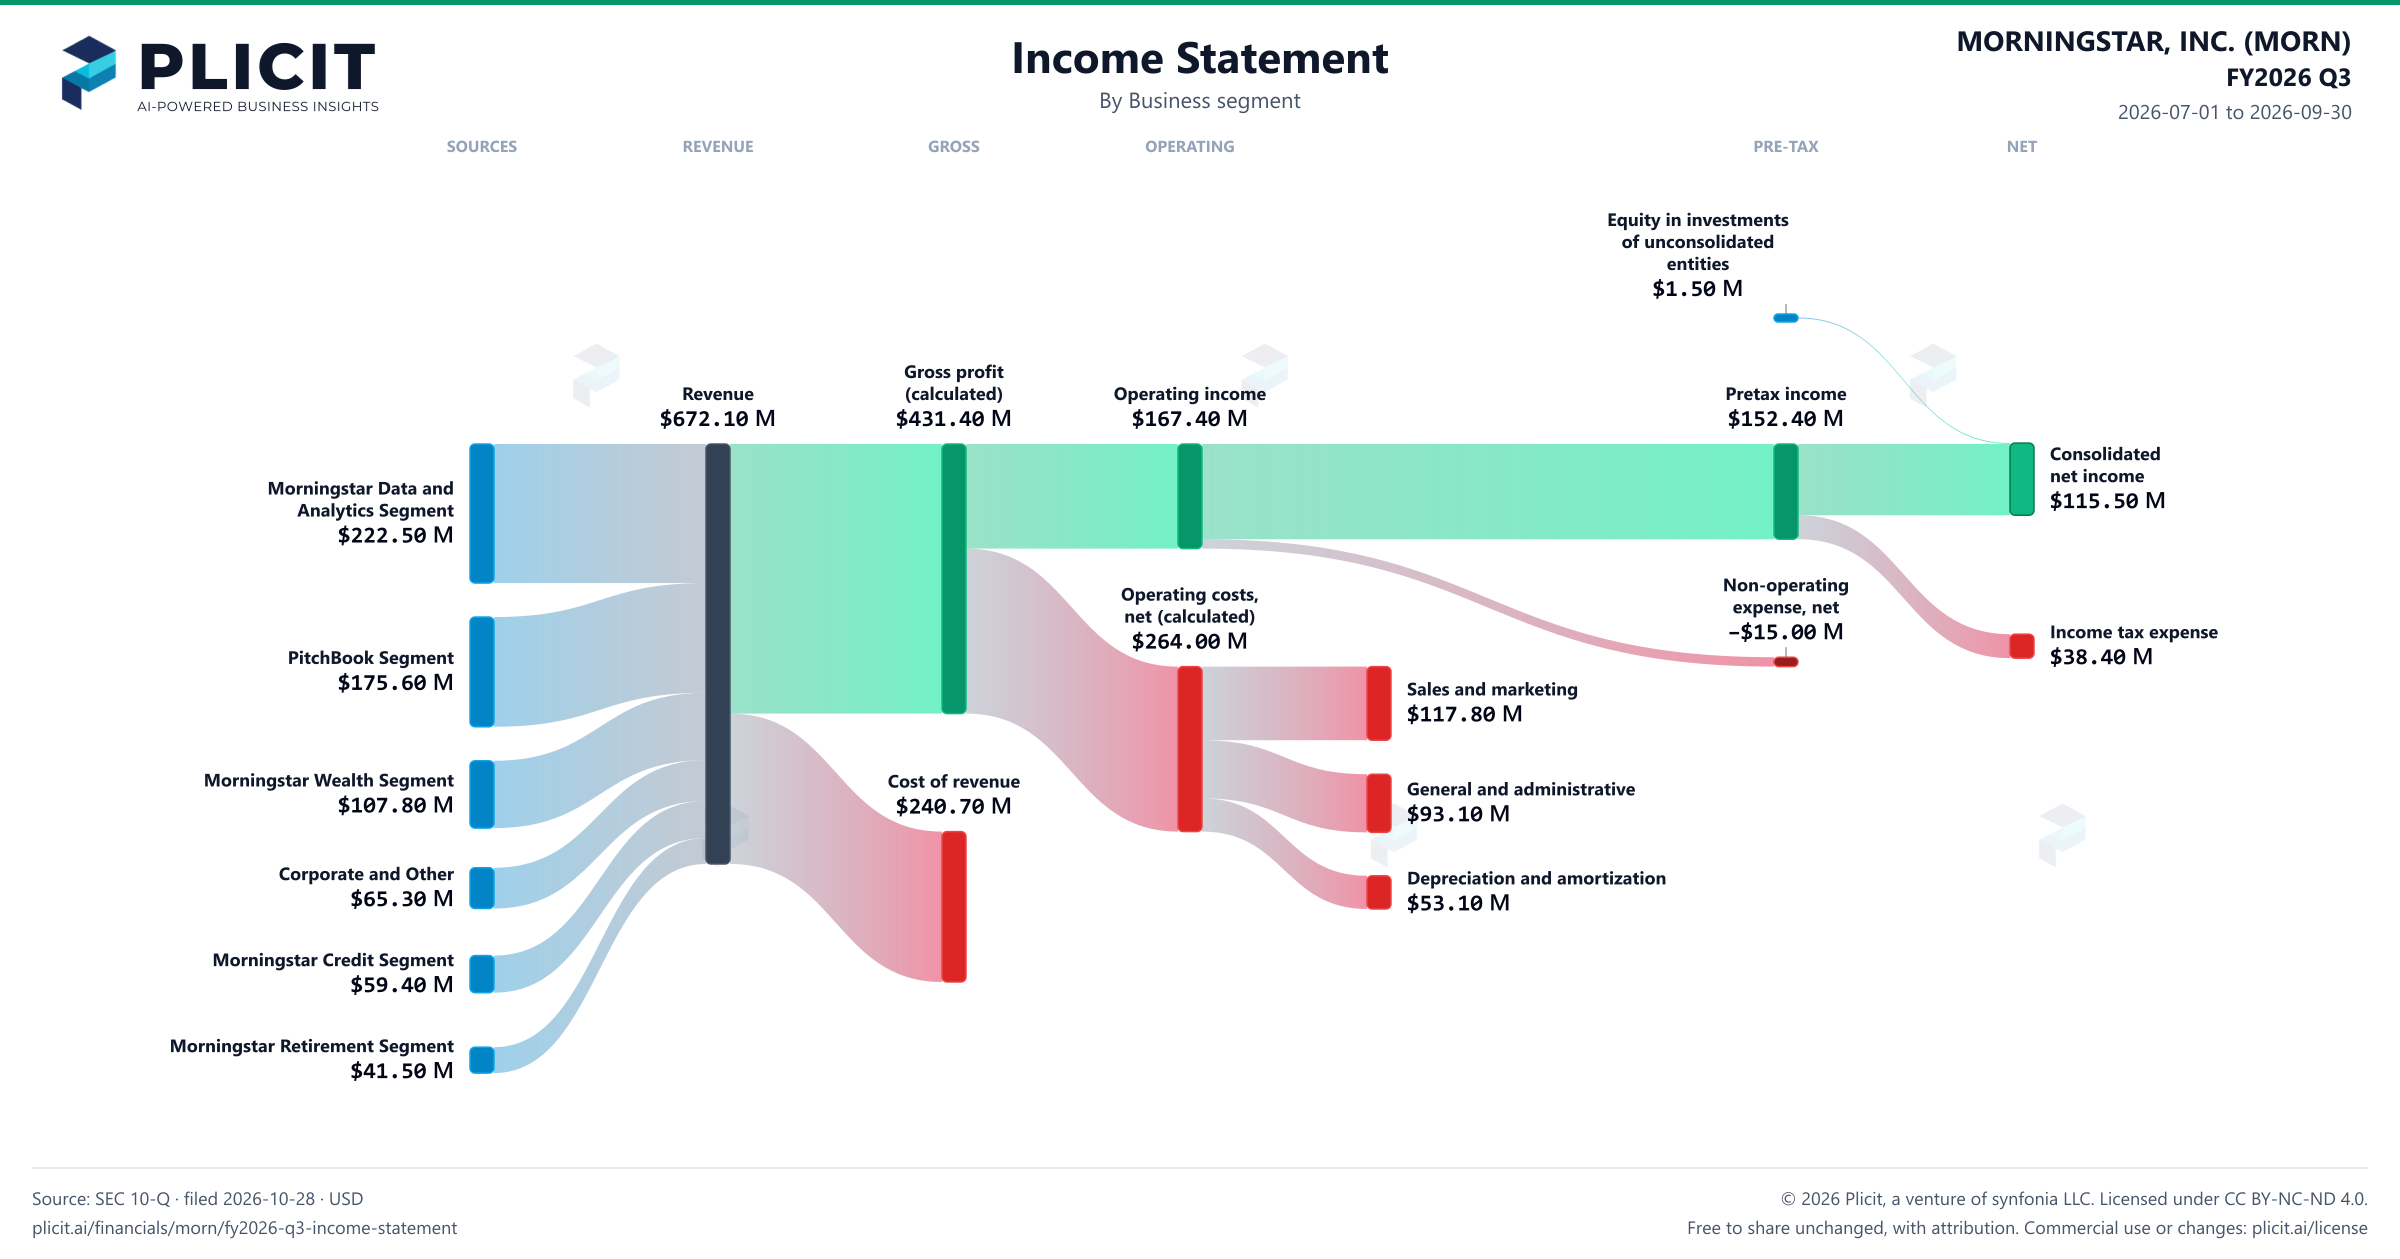
Revenue by Business Segment

Swipe to see the full flow
MORNINGSTAR, INC. (MORN) FY2026 Q3 P&L / Income StatementIncome statement for 2026-07-01 through 2026-09-30. View: Business segment. Revenue uses this breakdown; costs and expenses retain the consolidated categories.SOURCESREVENUEGROSSOPERATINGPRE-TAXNETMorningstar Data and Analytics SegmentPitchBook SegmentMorningstar Wealth SegmentCorporate and OtherMorningstar Credit SegmentMorningstar Retirement SegmentRevenueGross profit (calculated)Cost of revenueOperating incomeOperating costs, net of other operating income (calculated)Sales and marketingGeneral and administrativeDepreciation and amortizationIncome before income taxes and equity in investments of unconsolidated entitiesNon-operating expense, netConsolidated net incomeIncome tax expenseEquity in investments of unconsolidated entitiesEquity in investments of unconsolidated entitiesEquity in investmentsof unconsolidatedentities$1.50 MGross profit (calculated)Gross profit(calculated)$431.40 MRevenueRevenue$672.10 MOperating incomeOperating income$167.40 MIncome before income taxes and equity in investments of unconsolidated entitiesPretax income$152.40 MConsolidated net incomeConsolidatednet income$115.50 MMorningstar Data and Analytics SegmentMorningstar Data andAnalytics Segment$222.50 MOperating costs, net of other operating income (calculated)Operating costs,net (calculated)$264.00 MIncome tax expenseIncome tax expense$38.40 MPitchBook SegmentPitchBook Segment$175.60 MNon-operating expense, netNon-operatingexpense, net−$15.00 MSales and marketingSales and marketing$117.80 MMorningstar Wealth SegmentMorningstar Wealth Segment$107.80 MCost of revenueCost of revenue$240.70 MGeneral and administrativeGeneral and administrative$93.10 MCorporate and OtherCorporate and Other$65.30 MDepreciation and amortizationDepreciation and amortization$53.10 MMorningstar Credit SegmentMorningstar Credit Segment$59.40 MMorningstar Retirement SegmentMorningstar Retirement Segment$41.50 M
Chart details

MORNINGSTAR, INC. (MORN) FY2026 Q3 P&L / Income Statement

Income statement for 2026-07-01 through 2026-09-30. View: Business segment. Revenue uses this breakdown; costs and expenses retain the consolidated categories.

Revenue
672,100,000 US dollars
Cost of revenue
240,700,000 US dollars
Gross profit (calculated)
431,400,000 US dollars
Operating costs, net of other operating income (calculated)
264,000,000 US dollars
Operating income
167,400,000 US dollars
Non-operating expense, net
negative 15,000,000 US dollars
Income before income taxes and equity in investments of unconsolidated entities
152,400,000 US dollars
Income tax expense
38,400,000 US dollars
Consolidated net income
115,500,000 US dollars
Morningstar Data and Analytics Segment
222,500,000 US dollars
PitchBook Segment
175,600,000 US dollars
Morningstar Credit Segment
59,400,000 US dollars
Morningstar Wealth Segment
107,800,000 US dollars
Morningstar Retirement Segment
41,500,000 US dollars
Corporate and Other
65,300,000 US dollars
Sales and marketing
117,800,000 US dollars
General and administrative
93,100,000 US dollars
Depreciation and amortization
53,100,000 US dollars
Other operating income
0 US dollars
Equity in investments of unconsolidated entities
1,500,000 US dollars. Reported below-tax contribution to net income.

Chart connections

  • Revenue less cost of revenue equals gross profit; gross profit less operating expenses equals operating income.
  • Operating income plus other income or expense equals income before tax. Income before tax less income tax expense or benefit, plus the explicitly reported below-tax contributions, equals net income.
MORNINGSTAR, INC. (MORN) FY2026 Q3 Revenue by Business Segment Sankey chart
Free to share unchanged, with credit to Plicit.ai · CC BY-NC-ND 4.0Download PNG

Intelligent Insights for Investors

Which of Morningstar's businesses brings in the most sales?

The top spot goes to the Direct Platform line, at 33% of sales this quarter. Second is PitchBook, at 26%.

Which parts of Morningstar's sales by business drove the change over the past year?

Morningstar Credit added the most: $16.70 M of the $54.70 M rise in revenue from a year earlier.

Intelligent Insights for Lenders

Where is Morningstar's acquisition goodwill concentrated across its divisions?

PitchBook carries 36% of the $1.75 B of goodwill from past acquisitions on September 30, 2026.

Product waitlist

Health Check and Teardown for your own company

A health check uncovers insights of your private books, not a public ticker. Join this list to get notified as soon as we go-live!