
MORNINGSTAR, INC. (MORN) FY2026 Q3 P&L / Income Statement

Published · Updated Source: Form 10-Q on SEC EDGAR filed (opens in a new tab)

Key Takeaways

  • The United States brought in $485.20 M of $672.10 M in sales this quarter, or 72%.
  • Only the UK shrank, slipping 1.2% to $47.60 M while the whole business grew 8.9%.
  • The US holds 75% of its property and equipment, so its physical footprint follows its sales.
  • About 87% of its cash, cash equivalents and investments sits outside the US, up from 81%.

The Unvarnished Truth

72% of sales come from the US, and most cash sits abroad

Morningstar's biggest market is the United States, which brought in $485.20 M of $672.10 M in sales this quarter, or 72%. Revenue from outside the US reached $186.90 M, up 5.8% from $176.70 M a year earlier, so the US did most of the growing. Its home market accounted for 81% of the $54.70 M rise in quarterly sales. The company's own note says revenue is booked to the country where the sale was contracted. Continental Europe is the runner-up, at $58.60 M, and the rest of the world is small.

The cash tells a different story: about 87% of its cash, cash equivalents and investments sits outside the US, up from 81%. Management generally treats the earnings of most foreign subsidiaries as permanently reinvested, but it expects to bring $91.00 M back to the US in 2026. Bringing that money home would trigger a deferred tax liability of $1.40 M, mostly for non-US withholding taxes. Whether the rest stays abroad to fund growth is the question the filing leaves open.

For a reader, this is a company whose sales and cash are split between an American core and a large foreign balance that the filing treats as permanently reinvested. Currency swings can nudge reported sales, since 28% of the quarter's sales were earned abroad. Growth at home was 10.1%, faster than the 5.8% abroad, so the home market is the engine of the business. Will the foreign cash come home and fund the buybacks, or will it stay abroad to fund growth elsewhere?
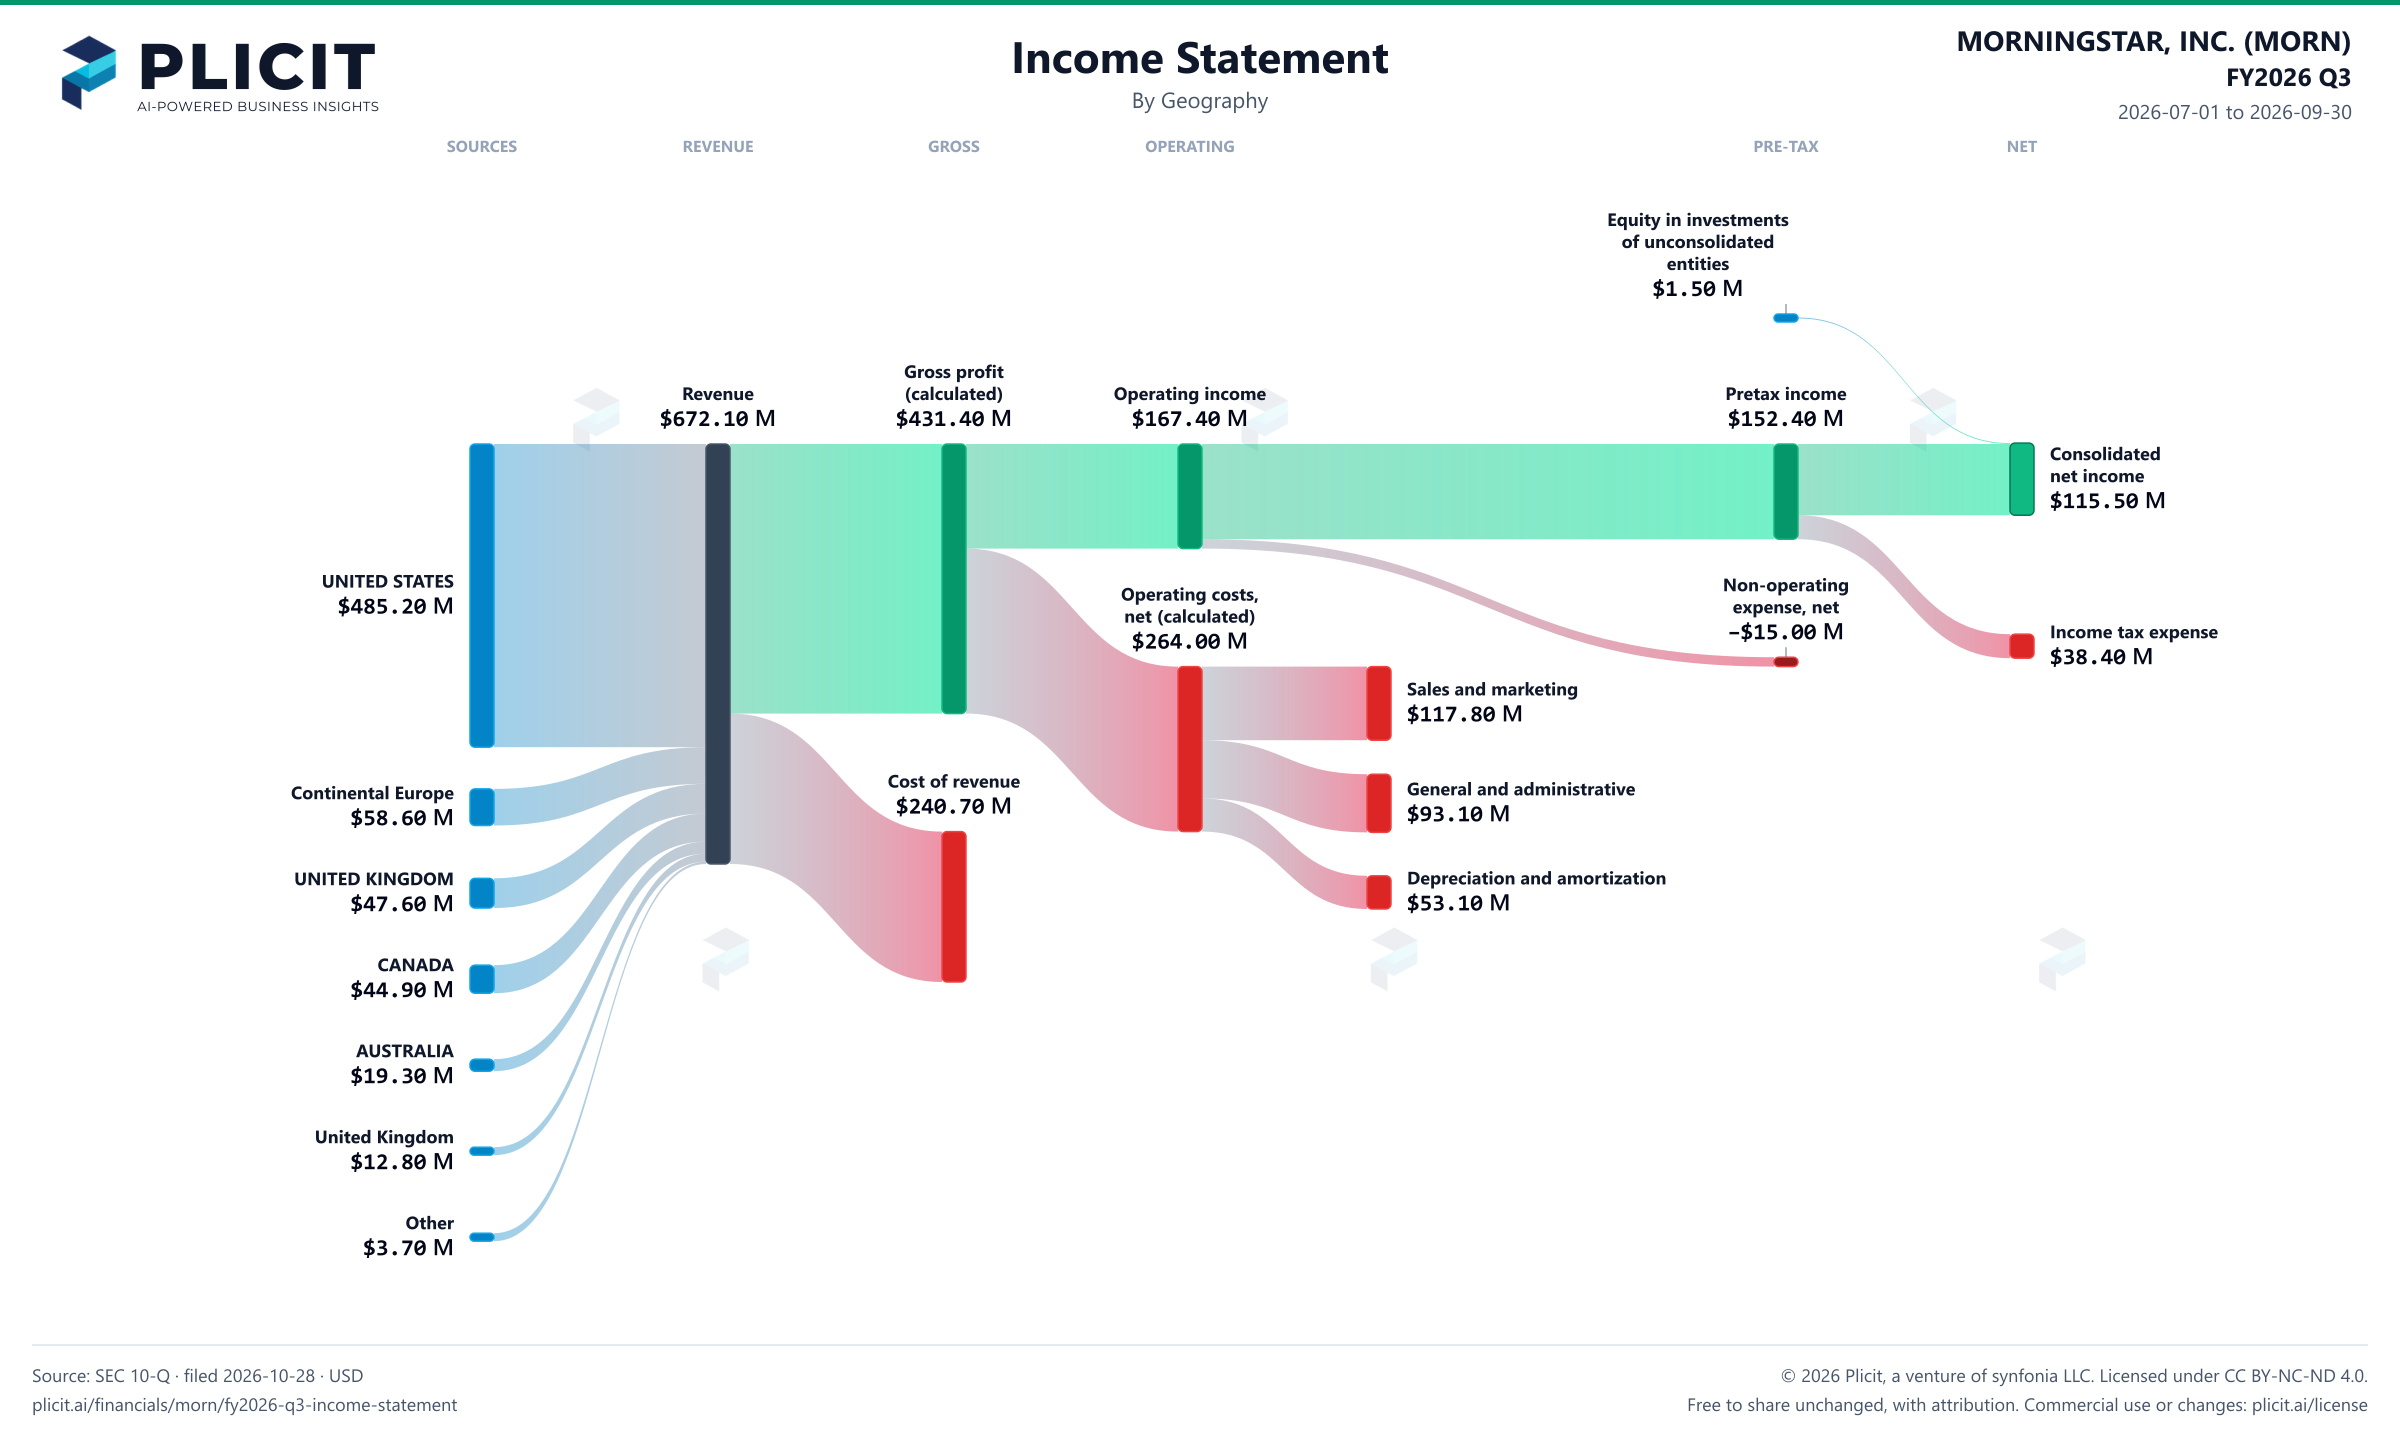
Revenue by Geography

Swipe to see the full flow
MORNINGSTAR, INC. (MORN) FY2026 Q3 P&L / Income StatementIncome statement for 2026-07-01 through 2026-09-30. View: Geography. Revenue uses this breakdown; costs and expenses retain the consolidated categories.SOURCESREVENUEGROSSOPERATINGPRE-TAXNETUNITED STATESContinental EuropeUNITED KINGDOMCANADAAUSTRALIAUnited KingdomOtherRevenueGross profit (calculated)Cost of revenueOperating incomeOperating costs, net of other operating income (calculated)Sales and marketingGeneral and administrativeDepreciation and amortizationIncome before income taxes and equity in investments of unconsolidated entitiesNon-operating expense, netConsolidated net incomeIncome tax expenseEquity in investments of unconsolidated entitiesEquity in investments of unconsolidated entitiesEquity in investmentsof unconsolidatedentities$1.50 MGross profit (calculated)Gross profit(calculated)$431.40 MRevenueRevenue$672.10 MOperating incomeOperating income$167.40 MIncome before income taxes and equity in investments of unconsolidated entitiesPretax income$152.40 MConsolidated net incomeConsolidatednet income$115.50 MUNITED STATESUNITED STATES$485.20 MOperating costs, net of other operating income (calculated)Operating costs,net (calculated)$264.00 MIncome tax expenseIncome tax expense$38.40 MNon-operating expense, netNon-operatingexpense, net−$15.00 MSales and marketingSales and marketing$117.80 MCost of revenueCost of revenue$240.70 MGeneral and administrativeGeneral and administrative$93.10 MContinental EuropeContinental Europe$58.60 MDepreciation and amortizationDepreciation and amortization$53.10 MUNITED KINGDOMUNITED KINGDOM$47.60 MCANADACANADA$44.90 MAUSTRALIAAUSTRALIA$19.30 MUnited KingdomUnited Kingdom$12.80 MOtherOther$3.70 M
Chart details

MORNINGSTAR, INC. (MORN) FY2026 Q3 P&L / Income Statement

Income statement for 2026-07-01 through 2026-09-30. View: Geography. Revenue uses this breakdown; costs and expenses retain the consolidated categories.

Revenue
672,100,000 US dollars
Cost of revenue
240,700,000 US dollars
Gross profit (calculated)
431,400,000 US dollars
Operating costs, net of other operating income (calculated)
264,000,000 US dollars
Operating income
167,400,000 US dollars
Non-operating expense, net
negative 15,000,000 US dollars
Income before income taxes and equity in investments of unconsolidated entities
152,400,000 US dollars
Income tax expense
38,400,000 US dollars
Consolidated net income
115,500,000 US dollars
UNITED KINGDOM
47,600,000 US dollars
Continental Europe
58,600,000 US dollars
AUSTRALIA
19,300,000 US dollars
CANADA
44,900,000 US dollars
United Kingdom
12,800,000 US dollars
Other
3,700,000 US dollars
UNITED STATES
485,200,000 US dollars
Sales and marketing
117,800,000 US dollars
General and administrative
93,100,000 US dollars
Depreciation and amortization
53,100,000 US dollars
Other operating income
0 US dollars
Equity in investments of unconsolidated entities
1,500,000 US dollars. Reported below-tax contribution to net income.

Chart connections

  • Revenue less cost of revenue equals gross profit; gross profit less operating expenses equals operating income.
  • Operating income plus other income or expense equals income before tax. Income before tax less income tax expense or benefit, plus the explicitly reported below-tax contributions, equals net income.
MORNINGSTAR, INC. (MORN) FY2026 Q3 Revenue by Geography Sankey chart
Free to share unchanged, with credit to Plicit.ai · CC BY-NC-ND 4.0Download PNG

Intelligent Insights for Investors

How much of Morningstar's sales come from outside its home country?

Less than half: $186.90 M, or 28% of sales this quarter, came from outside the United States. Sales abroad are often earned in other currencies, so exchange-rate swings can nudge the reported totals.

Where are Morningstar's factories, offices and other long-term assets located?

Mostly in the United States: the US holds 75% of its property and equipment and brings in 72% of its sales this quarter.

Intelligent Insights for Lenders

How much of Morningstar's cash is held by foreign subsidiaries?

About 87% of its cash, cash equivalents and investments was held outside the US on September 30, 2026. Management has recorded $1.40 M of deferred tax on the $91.00 M it expects to distribute in 2026.

Product waitlist

Health Check and Teardown for your own company

A health check uncovers insights of your private books, not a public ticker. Join this list to get notified as soon as we go-live!