
MORNINGSTAR, INC. (MORN) FY2026 Q3 P&L / Income Statement

Published · Updated Source: Form 10-Q on SEC EDGAR filed (opens in a new tab)

Key Takeaways

  • Direct Platform's license sales were $222.40 M of its $222.50 M, nearly all of the line.
  • PitchBook transaction revenue fell 14.3% to $1.80 M, while its license sales rose.
  • Wealth license revenue dropped 26.2%, from $18.30 M to $13.50 M, the steepest drop of its three lines.
  • Credit transaction revenue rose 18.3% to $101.40 M, the largest sub-unit gain in this view.

The Unvarnished Truth

The biggest line is almost all license sales, and it grew 5.4%

The biggest piece of sales is the Direct Platform line at $222.50 M, and License-based makes up nearly all of it. Its license sales rose 5.4% from $211.10 M, adding $11.30 M of the $11.40 M rise in the line. Transaction sales inside that line were only $0.10 M, so nearly all the growth came from licenses. That makes the biggest business a license business in almost every sense. Its total line grew 5.4% to $222.50 M, the same pace as its license line.

Inside PitchBook, transaction revenue fell 14.3%, from $2.10 M to $1.80 M, while its license sales rose 4.1% to $173.80 M. Wealth license revenue fell 26.2%, while its asset-based fees rose 11.4%. Credit transaction revenue rose 18.3%, from $85.70 M to $101.40 M, the largest sub-unit gain in the view. Credit's license sales rose 18.5%, from $5.40 M to $6.40 M, on a much smaller base. Each of these moves sits inside a larger total, and the headline growth rate hides them.

For a reader, the nested view shows that the headline business is one product, sold on licenses. Wealth's license line is worth watching, since its 26.2% drop came in a quarter when total revenue grew 8.9%. Wealth as a whole fell 4.3%, and its license line fell faster than any other part of that unit. Transaction revenue inside Wealth fell 22.1%, which makes the license drop the sharpest of the three. Will the license decline spread to the other lines, or is it a one-quarter dip?
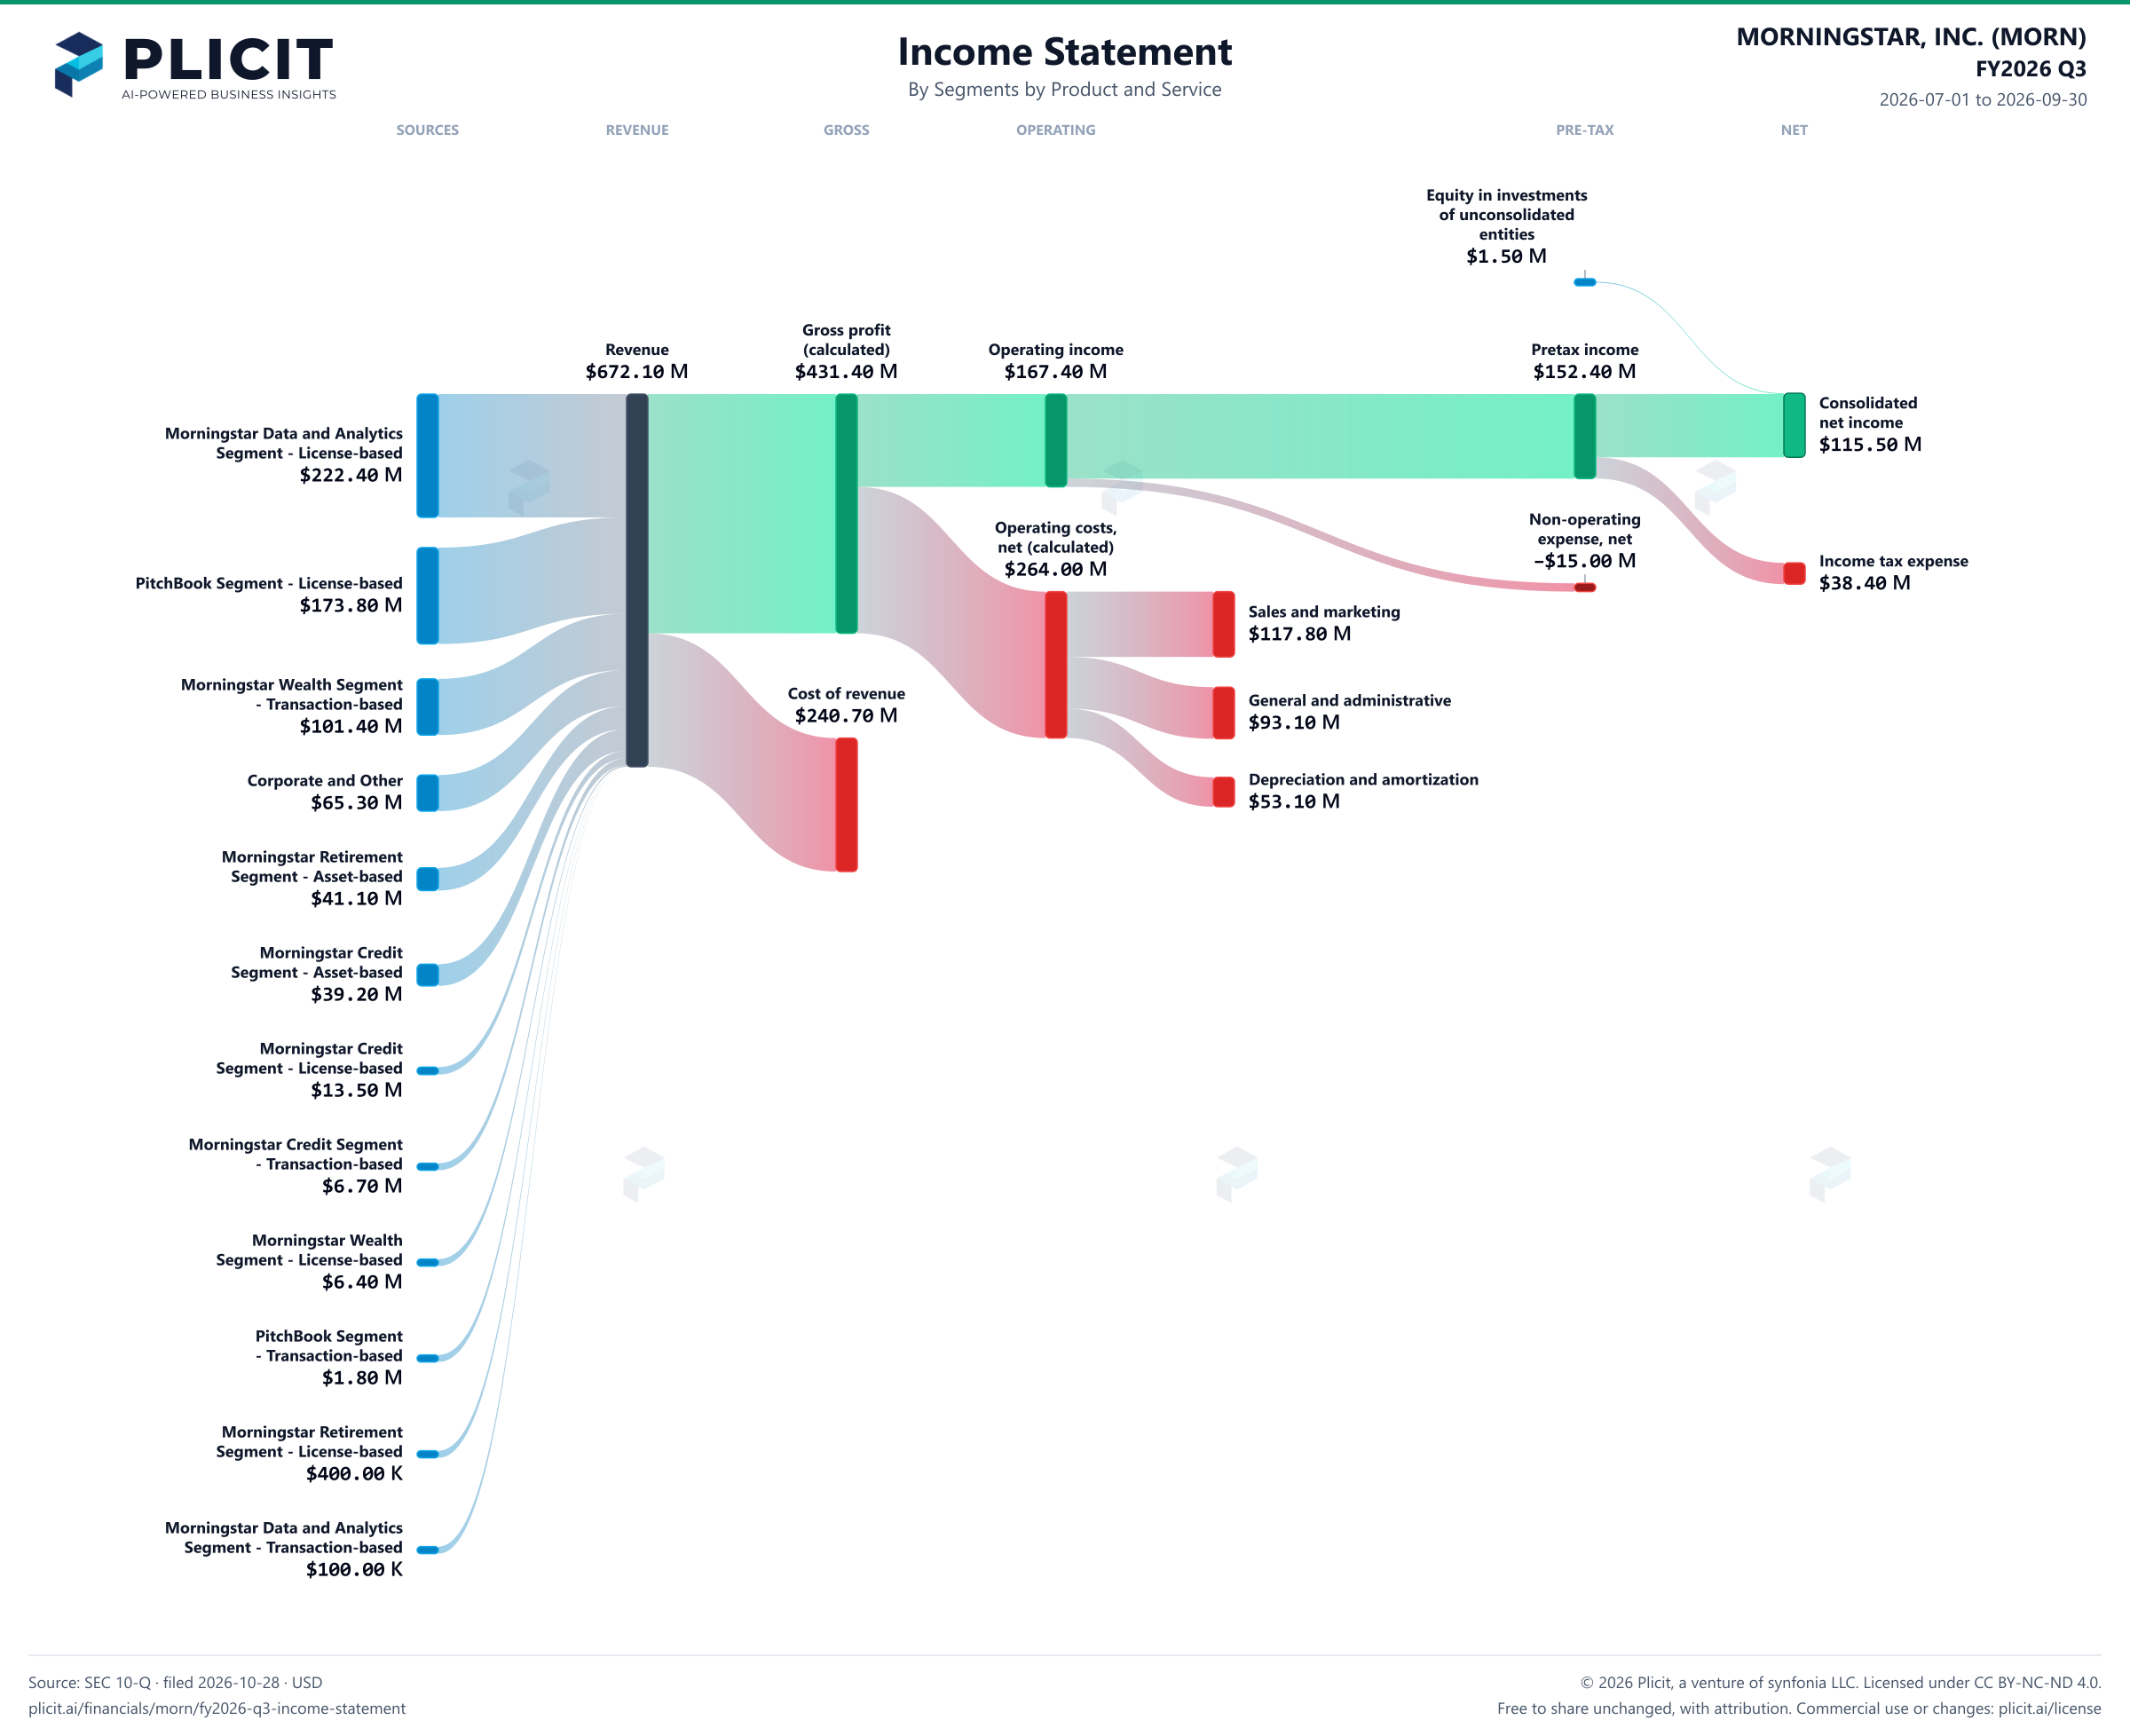
Revenue by Business Segment by Product and Service

Swipe to see the full flow
MORNINGSTAR, INC. (MORN) FY2026 Q3 P&L / Income StatementIncome statement for 2026-07-01 through 2026-09-30. View: Segments by Product and Service. Revenue uses this breakdown; costs and expenses retain the consolidated categories.SOURCESREVENUEGROSSOPERATINGPRE-TAXNETMorningstar Data and Analytics Segment - License-basedPitchBook Segment - License-basedMorningstar Wealth Segment - Transaction-basedCorporate and OtherMorningstar Retirement Segment - Asset-basedMorningstar Credit Segment - Asset-basedMorningstar Credit Segment - License-basedMorningstar Credit Segment - Transaction-basedMorningstar Wealth Segment - License-basedPitchBook Segment - Transaction-basedMorningstar Retirement Segment - License-basedMorningstar Data and Analytics Segment - Transaction-basedRevenueGross profit (calculated)Cost of revenueOperating incomeOperating costs, net of other operating income (calculated)Sales and marketingGeneral and administrativeDepreciation and amortizationIncome before income taxes and equity in investments of unconsolidated entitiesNon-operating expense, netConsolidated net incomeIncome tax expenseEquity in investments of unconsolidated entitiesEquity in investments of unconsolidated entitiesEquity in investmentsof unconsolidatedentities$1.50 MGross profit (calculated)Gross profit(calculated)$431.40 MRevenueRevenue$672.10 MOperating incomeOperating income$167.40 MIncome before income taxes and equity in investments of unconsolidated entitiesPretax income$152.40 MConsolidated net incomeConsolidatednet income$115.50 MMorningstar Data and Analytics Segment - License-basedMorningstar Data and AnalyticsSegment - License-based$222.40 MOperating costs, net of other operating income (calculated)Operating costs,net (calculated)$264.00 MIncome tax expenseIncome tax expense$38.40 MPitchBook Segment - License-basedPitchBook Segment - License-based$173.80 MNon-operating expense, netNon-operatingexpense, net−$15.00 MSales and marketingSales and marketing$117.80 MMorningstar Wealth Segment - Transaction-basedMorningstar Wealth Segment- Transaction-based$101.40 MCost of revenueCost of revenue$240.70 MGeneral and administrativeGeneral and administrative$93.10 MDepreciation and amortizationDepreciation and amortization$53.10 MCorporate and OtherCorporate and Other$65.30 MMorningstar Retirement Segment - Asset-basedMorningstar RetirementSegment - Asset-based$41.10 MMorningstar Credit Segment - Asset-basedMorningstar CreditSegment - Asset-based$39.20 MMorningstar Credit Segment - License-basedMorningstar CreditSegment - License-based$13.50 MMorningstar Credit Segment - Transaction-basedMorningstar Credit Segment- Transaction-based$6.70 MMorningstar Wealth Segment - License-basedMorningstar WealthSegment - License-based$6.40 MPitchBook Segment - Transaction-basedPitchBook Segment- Transaction-based$1.80 MMorningstar Retirement Segment - License-basedMorningstar RetirementSegment - License-based$400.00 KMorningstar Data and Analytics Segment - Transaction-basedMorningstar Data and AnalyticsSegment - Transaction-based$100.00 K
Chart details

MORNINGSTAR, INC. (MORN) FY2026 Q3 P&L / Income Statement

Income statement for 2026-07-01 through 2026-09-30. View: Segments by Product and Service. Revenue uses this breakdown; costs and expenses retain the consolidated categories.

Revenue
672,100,000 US dollars
Cost of revenue
240,700,000 US dollars
Gross profit (calculated)
431,400,000 US dollars
Operating costs, net of other operating income (calculated)
264,000,000 US dollars
Operating income
167,400,000 US dollars
Non-operating expense, net
negative 15,000,000 US dollars
Income before income taxes and equity in investments of unconsolidated entities
152,400,000 US dollars
Income tax expense
38,400,000 US dollars
Consolidated net income
115,500,000 US dollars
Corporate and Other
65,300,000 US dollars
Morningstar Credit Segment - Asset-based
39,200,000 US dollars
Morningstar Credit Segment - License-based
13,500,000 US dollars
Morningstar Credit Segment - Transaction-based
6,700,000 US dollars
Morningstar Data and Analytics Segment - Asset-based
0 US dollars
Morningstar Data and Analytics Segment - License-based
222,400,000 US dollars
Morningstar Data and Analytics Segment - Transaction-based
100,000 US dollars
Morningstar Retirement Segment - Asset-based
41,100,000 US dollars
Morningstar Retirement Segment - License-based
400,000 US dollars
Morningstar Retirement Segment - Transaction-based
0 US dollars
Morningstar Wealth Segment - Asset-based
0 US dollars
Morningstar Wealth Segment - License-based
6,400,000 US dollars
Morningstar Wealth Segment - Transaction-based
101,400,000 US dollars
PitchBook Segment - Asset-based
0 US dollars
PitchBook Segment - License-based
173,800,000 US dollars
PitchBook Segment - Transaction-based
1,800,000 US dollars
Sales and marketing
117,800,000 US dollars
General and administrative
93,100,000 US dollars
Depreciation and amortization
53,100,000 US dollars
Other operating income
0 US dollars
Equity in investments of unconsolidated entities
1,500,000 US dollars. Reported below-tax contribution to net income.

Chart connections

  • Revenue less cost of revenue equals gross profit; gross profit less operating expenses equals operating income.
  • Operating income plus other income or expense equals income before tax. Income before tax less income tax expense or benefit, plus the explicitly reported below-tax contributions, equals net income.
MORNINGSTAR, INC. (MORN) FY2026 Q3 Revenue by Business Segment by Product and Service Sankey chart
Free to share unchanged, with credit to Plicit.ai · CC BY-NC-ND 4.0Download PNG

Intelligent Insights for Investors

What is inside the biggest piece of Morningstar's sales?

Morningstar Direct Platform is the biggest piece: the products it lists brought in 33% of sales this quarter, and license-based made up 100% of them.

Is a line shrinking inside one of Morningstar's growing businesses?

Yes: inside PitchBook, transaction revenue fell 14.3% while its license sales rose 4.1%.

Intelligent Insights for Employees

What drove the change in Morningstar's biggest business over the past year?

Mostly license-based: it added $11.30 M of the $11.40 M rise in revenue from Morningstar Direct Platform, its largest group in this view.

Product waitlist

Health Check and Teardown for your own company

A health check uncovers insights of your private books, not a public ticker. Join this list to get notified as soon as we go-live!