
RESTAURANT BRANDS INTERNATIONAL INC. (QSR) FY2026 Q3 P&L / Income Statement

Published · Updated Source: Form 10-Q on SEC EDGAR filed (opens in a new tab)

Key Takeaways

  • Franchise and property revenues are 72% of this view and Advertising the other 28%.
  • Franchise and property revenues grew 4.6%, supplying 47% of the rise in revenue.
  • Advertising revenues and other services rose 2.9%, the slowest line in the view.
  • No part's share of revenue rose by as much as half a point, so the mix barely moved.

The Unvarnished Truth

Franchise and property revenues are 32% of sales and growing slowly

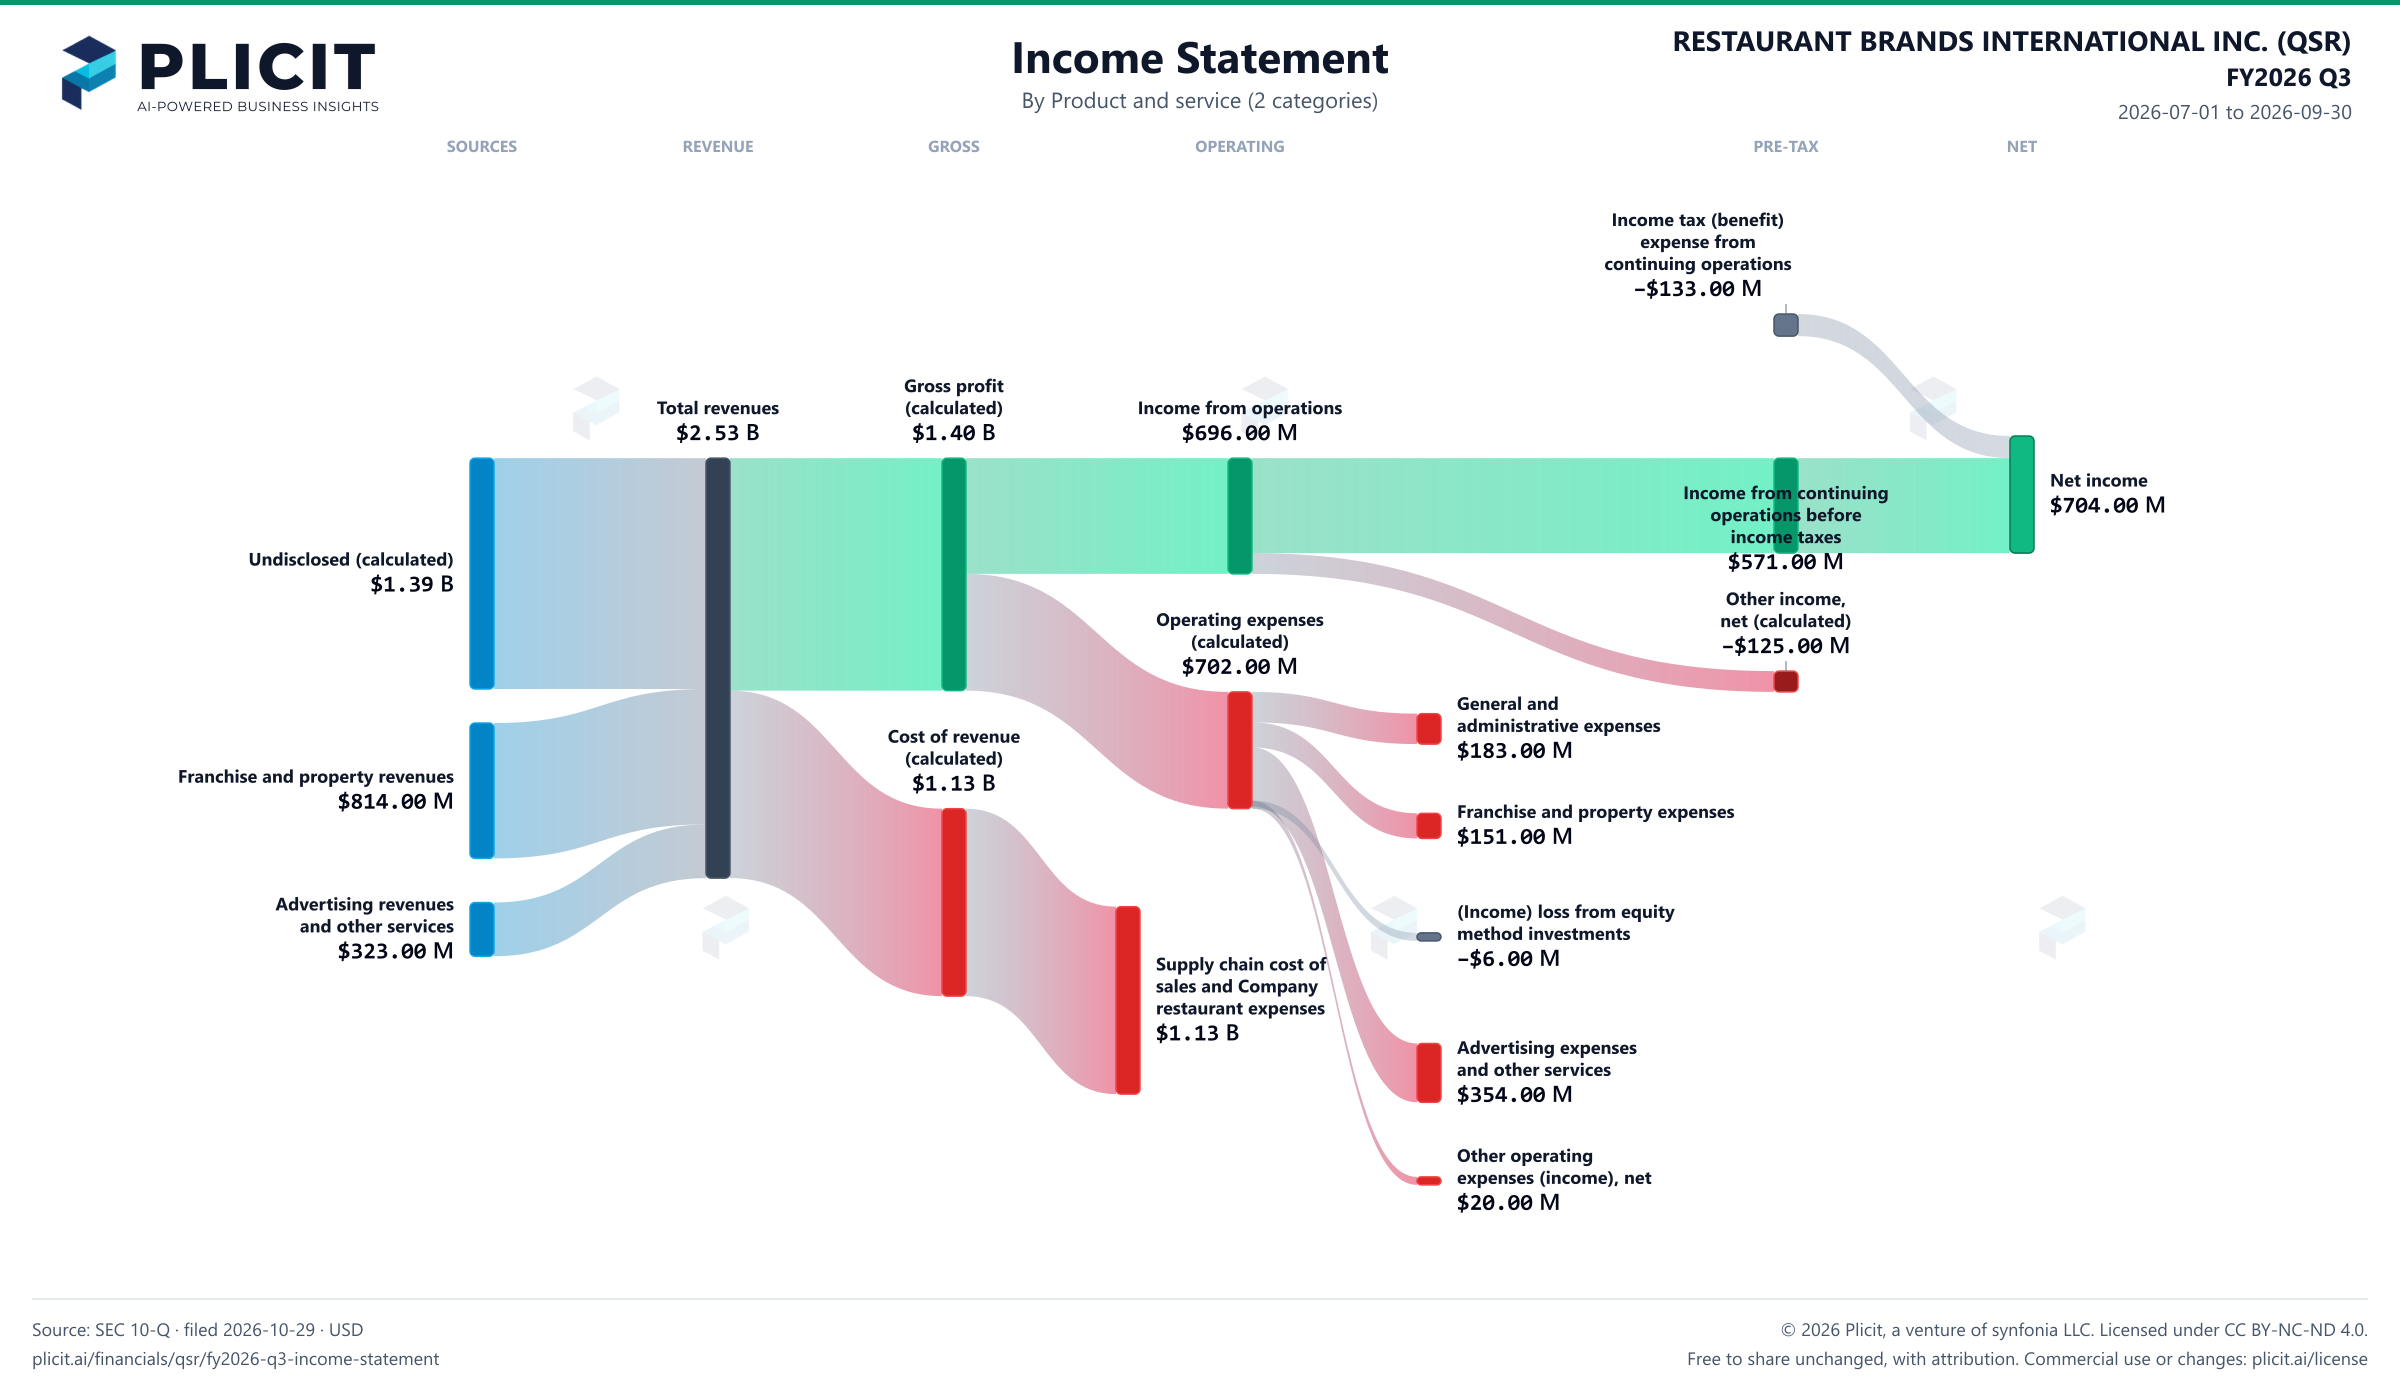
Franchise and property revenues are the biggest line in this view, at $814.00 M, or 32% of the company's $2.53 B of sales. Advertising revenues and other services bring in $323.00 M, and the two lines together cover only 45% of sales. That leaves 55% of sales outside the view, which is a bigger gap than the reader should accept without a note. Franchise and property revenues rose 4.6%, and they supplied 47% of the quarter's revenue rise. The mix barely moved: the largest line's share rose just under half a point.

The filing ties its rise to higher system-wide sales, which means growth follows what existing restaurants sell. Advertising revenues and other services rose 2.9%, against 3.1% for the whole, so it is not the one shrinking. The view's two lines account for $1.14 B, so the company's other sales sit in lines this cut leaves out. Read against the company's $2.53 B, the franchise line is a steady earner rather than a growth engine. The question is whether that steady earner can keep pace with the rest of the business.

For a reader, this view is the franchisor's view: fees and royalties from the system rather than the cost of running restaurants. Watch whether the franchise line keeps outgrowing advertising, and whether that gap narrows. Its 4.6% growth is the number a reader should track quarter to quarter. Its growth depends on system-wide sales, and those depend on the restaurants that operate in the system. A slower year there would hit the margin fast. Would the franchise line still beat advertising if system-wide sales stopped rising?
Revenue by Product and Service (2 categories)

Swipe to see the full flow
RESTAURANT BRANDS INTERNATIONAL INC. (QSR) FY2026 Q3 P&L / Income StatementIncome statement for 2026-07-01 through 2026-09-30. View: Product and service (2 categories). Revenue uses this breakdown; costs and expenses retain the consolidated categories.SOURCESREVENUEGROSSOPERATINGPRE-TAXNETUndisclosed (calculated)Franchise and property revenuesAdvertising revenues and other servicesTotal revenuesGross profit (calculated)Cost of revenue (calculated)Supply chain cost of sales and Company restaurant expensesIncome from operationsOperating expenses (calculated)General and administrative expensesFranchise and property expenses(Income) loss from equity method investmentsAdvertising expenses and other servicesOther operating expenses (income), netIncome from continuing operations before income taxesOther income (expense), net (calculated)Net incomeIncome tax (benefit) expense from continuing operationsIncome tax (benefit) expense from continuing operationsIncome tax (benefit)expense fromcontinuing operations−$133.00 MGross profit (calculated)Gross profit(calculated)$1.40 BTotal revenuesTotal revenues$2.53 BIncome from operationsIncome from operations$696.00 MNet incomeNet income$704.00 MUndisclosed (calculated)Undisclosed (calculated)$1.39 BIncome from continuing operations before income taxesIncome from continuingoperations beforeincome taxes$571.00 MOperating expenses (calculated)Operating expenses(calculated)$702.00 MGeneral and administrative expensesGeneral andadministrative expenses$183.00 MOther income (expense), net (calculated)Other income,net (calculated)−$125.00 MCost of revenue (calculated)Cost of revenue(calculated)$1.13 BFranchise and property revenuesFranchise and property revenues$814.00 MFranchise and property expensesFranchise and property expenses$151.00 M(Income) loss from equity method investments(Income) loss from equitymethod investments−$6.00 MAdvertising revenues and other servicesAdvertising revenuesand other services$323.00 MSupply chain cost of sales and Company restaurant expensesSupply chain cost ofsales and Companyrestaurant expenses$1.13 BAdvertising expenses and other servicesAdvertising expensesand other services$354.00 MOther operating expenses (income), netOther operatingexpenses (income), net$20.00 M
Chart details

RESTAURANT BRANDS INTERNATIONAL INC. (QSR) FY2026 Q3 P&L / Income Statement

Income statement for 2026-07-01 through 2026-09-30. View: Product and service (2 categories). Revenue uses this breakdown; costs and expenses retain the consolidated categories.

Total revenues
2,525,000,000 US dollars
Cost of revenue (calculated)
1,127,000,000 US dollars
Gross profit (calculated)
1,398,000,000 US dollars
Operating expenses (calculated)
702,000,000 US dollars
Income from operations
696,000,000 US dollars
Other income (expense), net (calculated)
negative 125,000,000 US dollars
Income from continuing operations before income taxes
571,000,000 US dollars
Income tax (benefit) expense from continuing operations
negative 133,000,000 US dollars
Net income
704,000,000 US dollars
Franchise and property revenues
814,000,000 US dollars
Advertising revenues and other services
323,000,000 US dollars
Undisclosed (calculated)
1,388,000,000 US dollars
Supply chain cost of sales and Company restaurant expenses
1,127,000,000 US dollars
Franchise and property expenses
151,000,000 US dollars
Advertising expenses and other services
354,000,000 US dollars
General and administrative expenses
183,000,000 US dollars
(Income) loss from equity method investments
negative 6,000,000 US dollars
Other operating expenses (income), net
20,000,000 US dollars
Net loss from discontinued operations (net of tax of $0)
0 US dollars. Reported below-tax contribution to net income.

Chart connections

  • Revenue less cost of revenue equals gross profit; gross profit less operating expenses equals operating income.
  • Operating income plus other income or expense equals income before tax. Income before tax less income tax expense or benefit, plus the explicitly reported below-tax contributions, equals net income.
  • Of which attributable to RESTAURANT BRANDS INTERNATIONAL INC.: $542.00 M; to noncontrolling interests: $162.00 M.
RESTAURANT BRANDS INTERNATIONAL INC. (QSR) FY2026 Q3 Revenue by Product and Service (2 categories) Sankey chart
Free to share unchanged, with credit to Plicit.ai · CC BY-NC-ND 4.0Download PNG

Intelligent Insights for Investors

What does Restaurant Brands International sell, and how much of each?

Franchise and property revenues is the biggest, at $814.00 M this quarter, or 32% of sales. Advertising revenues and other services follows, at $323.00 M.

How much does Restaurant Brands International depend on the biggest piece of its sales by product and service?

Heavily: Franchise and property revenues brought in 72% of these sales this quarter, against 28% for Advertising revenues and other services, the next largest. The two lines are the whole of this view, so the split is complete here.

Intelligent Insights for Employees

Which part of Restaurant Brands International's sales by product and service lost the most ground over the past year?

None of the parts shrank. Advertising revenues and other services gained least, growing 2.9% from a year earlier, against 3.1% for revenue as a whole.

Product waitlist

Health Check and Teardown for your own company

A health check uncovers insights of your private books, not a public ticker. Join this list to get notified as soon as we go-live!