
RESTAURANT BRANDS INTERNATIONAL INC. (QSR) FY2026 Q3 P&L / Income Statement

Published · Updated Source: Form 10-Q on SEC EDGAR filed (opens in a new tab)

Key Takeaways

  • The United States brings in 47% of sales, with Canada next at 41% and little else close.
  • Currency took $18.00 M off sales growth, cutting the 3.8% rise to 3.1%.
  • The Other group grew fastest, by 11%, while Canada gained least at 1.1%.
  • Canada and the United States together make up 88% of revenue, so one currency pair matters most.

The Unvarnished Truth

Two countries carry the sales, and currency swings the reported growth

The United States brings in $1.18 B of sales, 47% of the company's $2.53 B total. Canada is next at $1.04 B, or 41% of everything it sells. Those two countries make up 88% of sales, which leaves little room for anywhere else to matter. Read the geography this way and the company is mainly a North American business. That concentration is not a risk on its own, but it makes the exchange rate a central fact of the results. Exchange swings then reach the Canadian sales, a large share of the whole.

Growth in the geography is small: the United States rose 3.0% and Canada only 1.1%. The Other group grew fastest, by 11% from a year earlier, from a base of $304.00 M. Currency then took its bite: reported sales rose 3.1%, but 3.8% before currency, per the company's own table. The $18.00 M currency drag is small against $2.53 B, but it moves with markets, not with restaurants. The filing says results also reflect an unfavorable FX impact, so the reported gain understates the underlying one.

For a reader, the question is whether the two big countries are growing on their own terms. Canada grew only 1.1%, the slowest of the top two, and currency is the first place to look for the reason. The Other group is small, so a few good quarters there can move the mix quickly. Watch whether the Other group keeps taking a larger slice of the mix while Canada loses share. Would Canada still lag the United States once currency is removed from both?
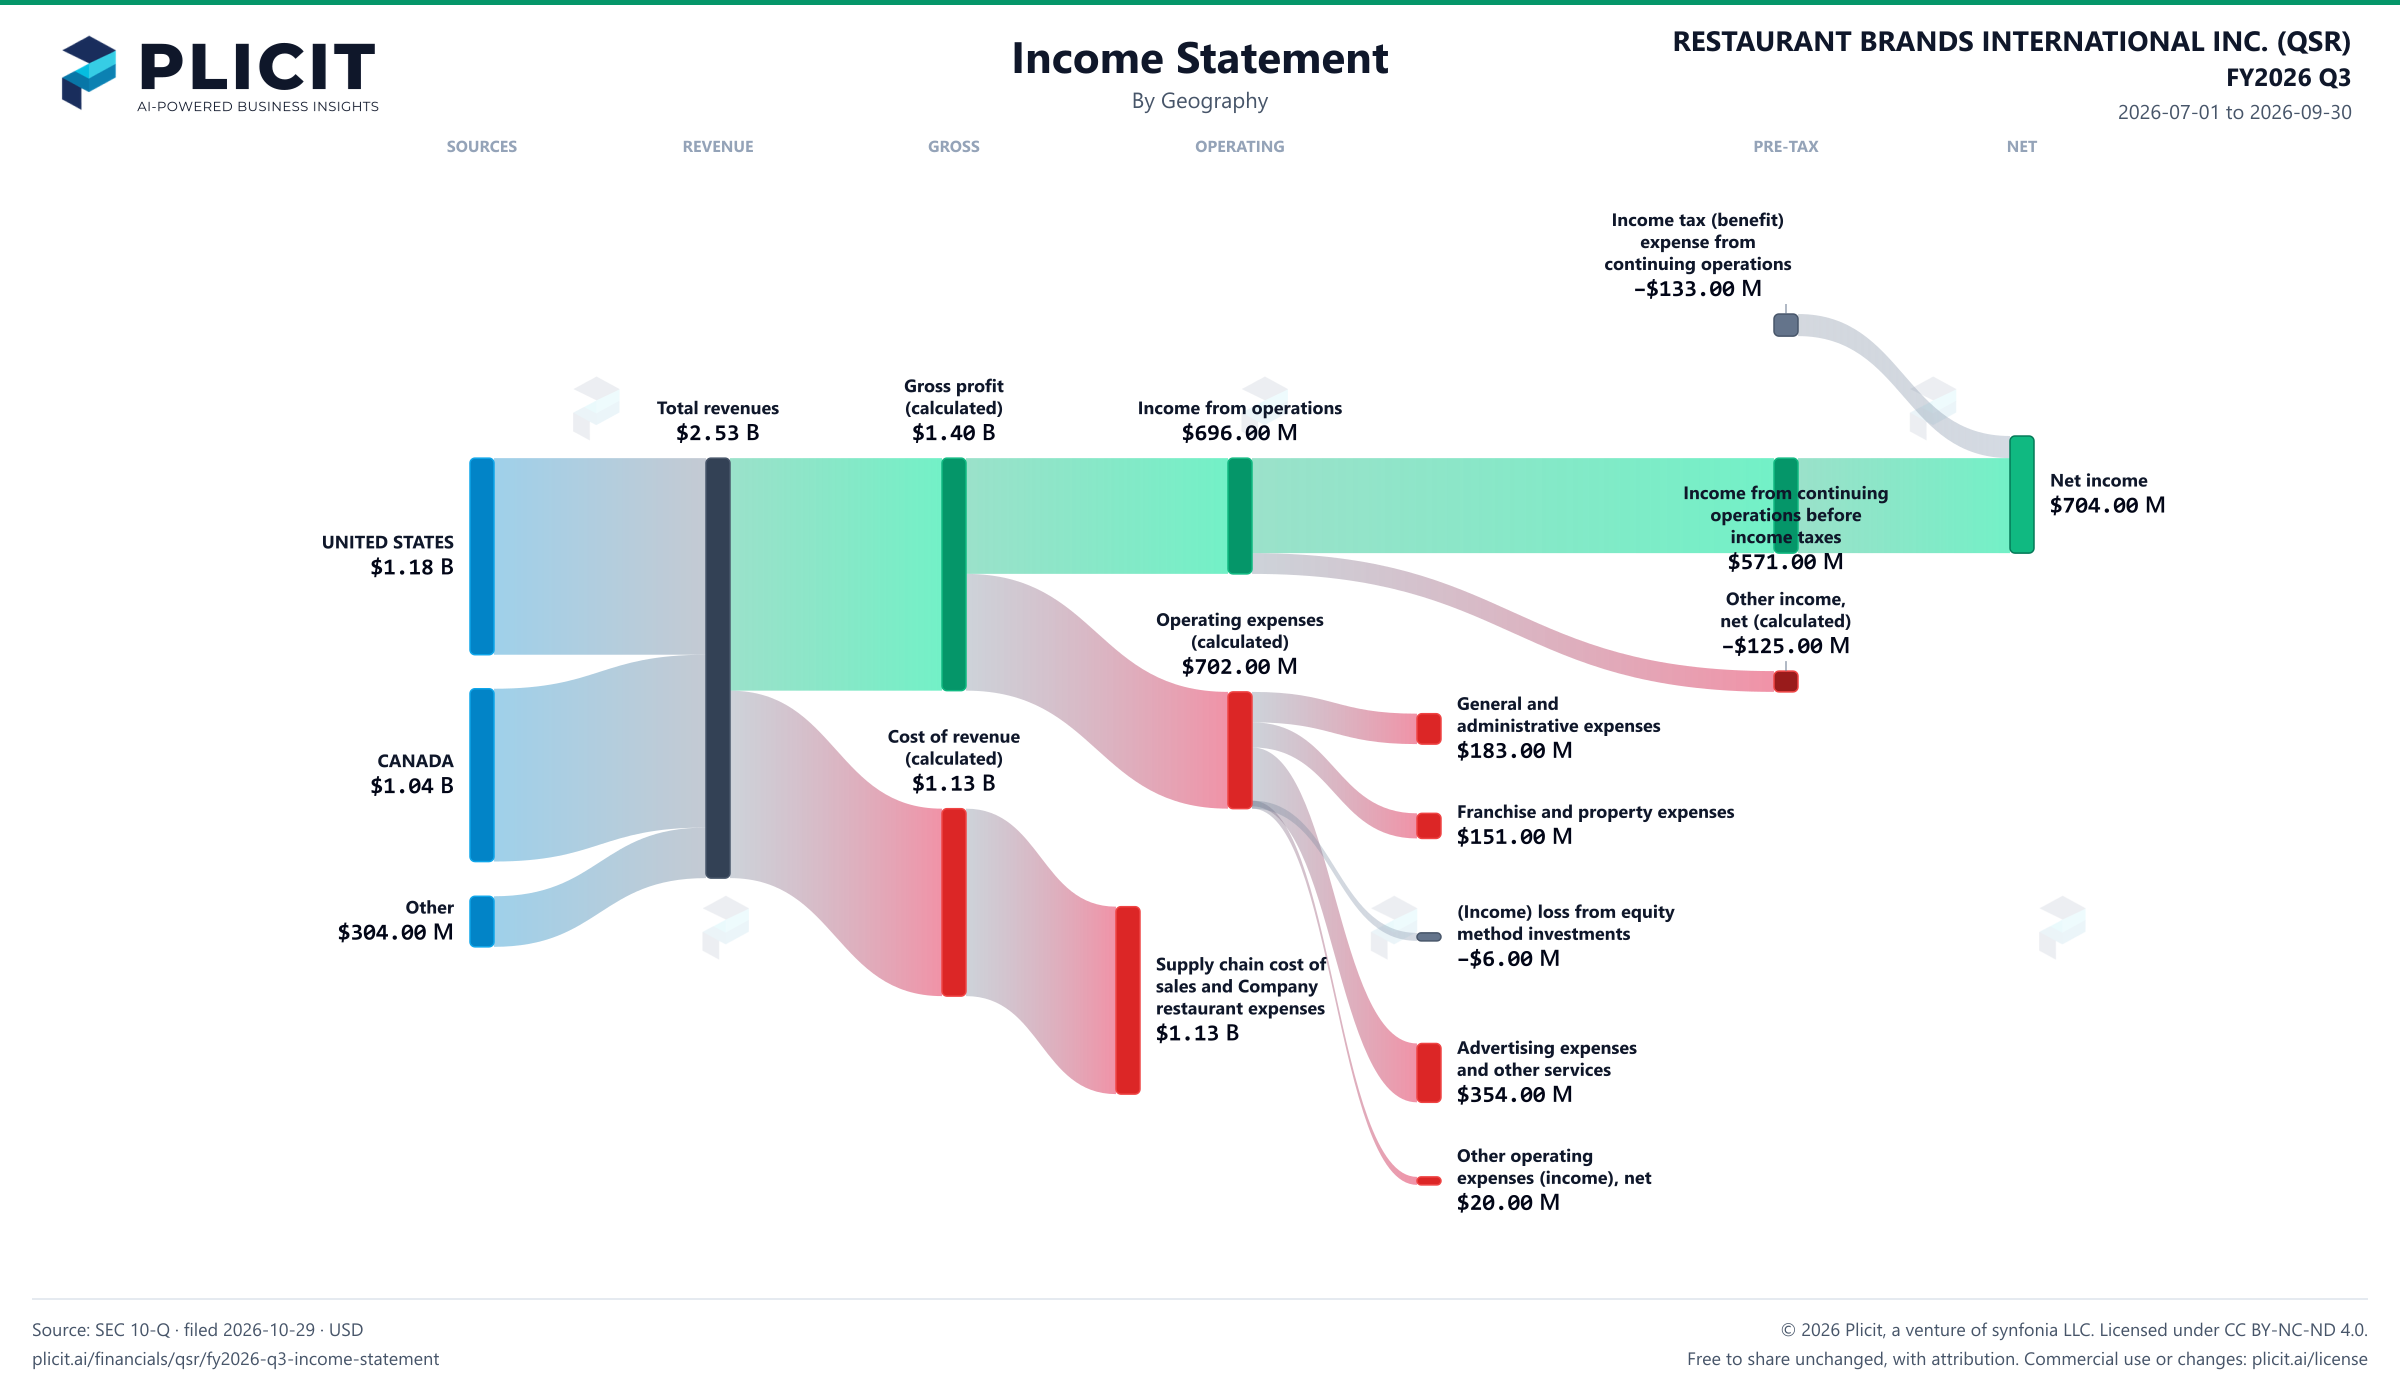
Revenue by Geography

Swipe to see the full flow
RESTAURANT BRANDS INTERNATIONAL INC. (QSR) FY2026 Q3 P&L / Income StatementIncome statement for 2026-07-01 through 2026-09-30. View: Geography. Revenue uses this breakdown; costs and expenses retain the consolidated categories.SOURCESREVENUEGROSSOPERATINGPRE-TAXNETUNITED STATESCANADAOtherTotal revenuesGross profit (calculated)Cost of revenue (calculated)Supply chain cost of sales and Company restaurant expensesIncome from operationsOperating expenses (calculated)General and administrative expensesFranchise and property expenses(Income) loss from equity method investmentsAdvertising expenses and other servicesOther operating expenses (income), netIncome from continuing operations before income taxesOther income (expense), net (calculated)Net incomeIncome tax (benefit) expense from continuing operationsIncome tax (benefit) expense from continuing operationsIncome tax (benefit)expense fromcontinuing operations−$133.00 MGross profit (calculated)Gross profit(calculated)$1.40 BTotal revenuesTotal revenues$2.53 BIncome from operationsIncome from operations$696.00 MNet incomeNet income$704.00 MUNITED STATESUNITED STATES$1.18 BIncome from continuing operations before income taxesIncome from continuingoperations beforeincome taxes$571.00 MOperating expenses (calculated)Operating expenses(calculated)$702.00 MGeneral and administrative expensesGeneral andadministrative expenses$183.00 MOther income (expense), net (calculated)Other income,net (calculated)−$125.00 MCost of revenue (calculated)Cost of revenue(calculated)$1.13 BCANADACANADA$1.04 BFranchise and property expensesFranchise and property expenses$151.00 M(Income) loss from equity method investments(Income) loss from equitymethod investments−$6.00 MOtherOther$304.00 MSupply chain cost of sales and Company restaurant expensesSupply chain cost ofsales and Companyrestaurant expenses$1.13 BAdvertising expenses and other servicesAdvertising expensesand other services$354.00 MOther operating expenses (income), netOther operatingexpenses (income), net$20.00 M
Chart details

RESTAURANT BRANDS INTERNATIONAL INC. (QSR) FY2026 Q3 P&L / Income Statement

Income statement for 2026-07-01 through 2026-09-30. View: Geography. Revenue uses this breakdown; costs and expenses retain the consolidated categories.

Total revenues
2,525,000,000 US dollars
Cost of revenue (calculated)
1,127,000,000 US dollars
Gross profit (calculated)
1,398,000,000 US dollars
Operating expenses (calculated)
702,000,000 US dollars
Income from operations
696,000,000 US dollars
Other income (expense), net (calculated)
negative 125,000,000 US dollars
Income from continuing operations before income taxes
571,000,000 US dollars
Income tax (benefit) expense from continuing operations
negative 133,000,000 US dollars
Net income
704,000,000 US dollars
UNITED STATES
1,182,000,000 US dollars
CANADA
1,039,000,000 US dollars
Other
304,000,000 US dollars
Supply chain cost of sales and Company restaurant expenses
1,127,000,000 US dollars
Franchise and property expenses
151,000,000 US dollars
Advertising expenses and other services
354,000,000 US dollars
General and administrative expenses
183,000,000 US dollars
(Income) loss from equity method investments
negative 6,000,000 US dollars
Other operating expenses (income), net
20,000,000 US dollars
Net loss from discontinued operations (net of tax of $0)
0 US dollars. Reported below-tax contribution to net income.

Chart connections

  • Revenue less cost of revenue equals gross profit; gross profit less operating expenses equals operating income.
  • Operating income plus other income or expense equals income before tax. Income before tax less income tax expense or benefit, plus the explicitly reported below-tax contributions, equals net income.
  • Of which attributable to RESTAURANT BRANDS INTERNATIONAL INC.: $542.00 M; to noncontrolling interests: $162.00 M.
RESTAURANT BRANDS INTERNATIONAL INC. (QSR) FY2026 Q3 Revenue by Geography Sankey chart
Free to share unchanged, with credit to Plicit.ai · CC BY-NC-ND 4.0Download PNG

Intelligent Insights for Investors

Where in the world does Restaurant Brands International make its sales?

The United States leads: it brought in 47% of sales this quarter, against 41% for Canada, the next largest. No other country comes close.

How much of Restaurant Brands International's sales come from outside the United States?

Most of them: 53% of sales this quarter came from outside the United States, against 53% a year earlier. Canada alone supplies most of that outside share.

Intelligent Insights for Suppliers

Which single foreign countries bring in at least 10% of Restaurant Brands International's sales?

One: Canada brought in 41% of sales this quarter. It is the only foreign country that clears that bar.

Product waitlist

Health Check and Teardown for your own company

A health check uncovers insights of your private books, not a public ticker. Join this list to get notified as soon as we go-live!