
RESTAURANT BRANDS INTERNATIONAL INC. (QSR) FY2026 Q3 P&L / Income Statement

Published · Updated Source: Form 10-Q on SEC EDGAR filed (opens in a new tab)

Key Takeaways

  • Tim Hortons brought in 45% of sales, against 19% for Restaurant Holdings.
  • Restaurant Holdings grew 6.1% and supplied 37% of the quarter's revenue rise.
  • Its adjusted operating income fell from $10.00 M to $5.00 M in the quarter.
  • Tim Hortons gained least, growing 1.0% against 3.1% for the company as a whole.

The Unvarnished Truth

Restaurant Holdings grows its sales while its profit shrinks

Tim Hortons is 45% of sales, and its $1.14 B is more than twice the next business, Restaurant Holdings. Restaurant Holdings is 19% of sales, and it supplied 37% of the quarter's revenue rise. Its revenue grew 6.1%, yet its adjusted operating income fell from $10.00 M to $5.00 M. The filing blames higher company restaurant expenses and segment general and administrative costs for the drop. Restaurant Holdings keeps about 1 cent of each sales dollar as adjusted operating income, against 28 cents at Tim Hortons.

Why would sales rise while profit falls? The filing points to a Burger King U.S. sales lift and a bigger PLK China restaurant count. Segment system-wide sales rose 5.2%, to $488.00 M, so the top line reflects real restaurant sales. The cost lines are where the profit went: company restaurant expenses rose $26.00 M against a $28.00 M revenue gain. The filing says the cost rise reflects higher Carrols Burger King costs and the scaling of international start-up businesses. Start-up restaurants take years to earn their keep, so the margin squeeze may be a timing issue rather than a broken model.

The next test is whether Restaurant Holdings can turn its sales into profit as the start-up stores mature. Watch the margin on Restaurant Holdings, which is thin next to the Tim Hortons figure. Its growth is real, so the question is whether the company can fix costs before sales growth runs out. Tim Hortons, by contrast, turns much more of each sales dollar into profit, so the mix shift matters. Would Restaurant Holdings' profit recover if its company restaurant costs grew no faster than its sales?
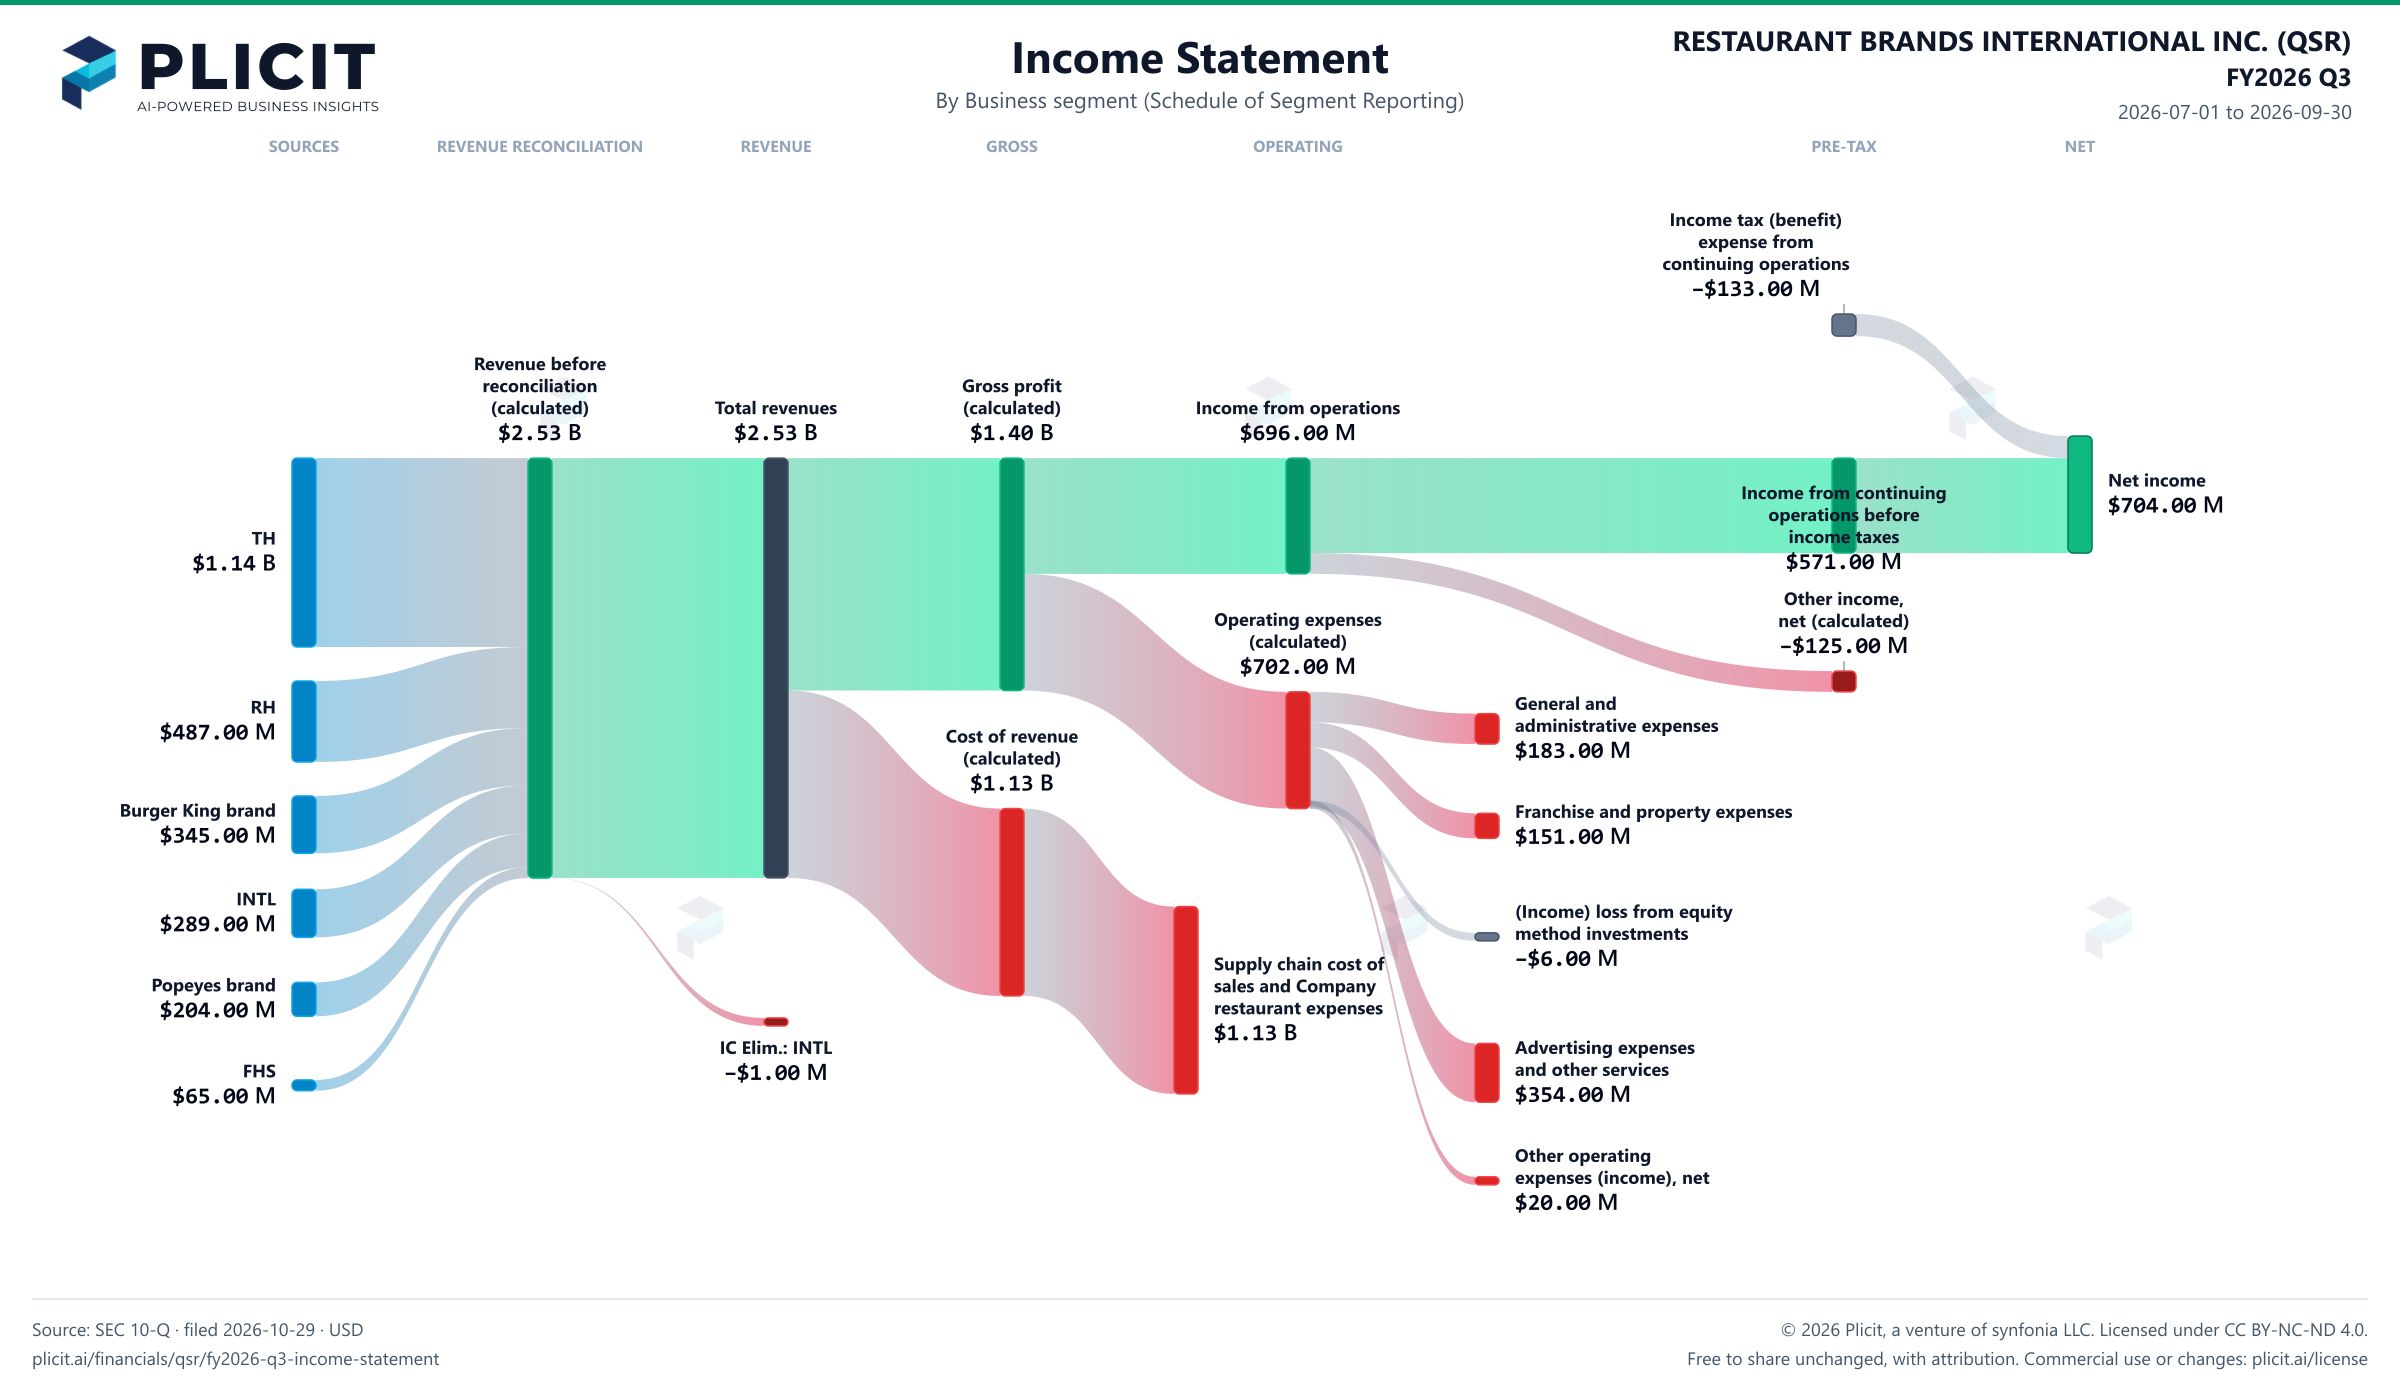
Revenue by Business Segment

Swipe to see the full flow
RESTAURANT BRANDS INTERNATIONAL INC. (QSR) FY2026 Q3 P&L / Income StatementIncome statement for 2026-07-01 through 2026-09-30. View: Business segment (Schedule of Segment Reporting). Revenue uses this breakdown; costs and expenses retain the consolidated categories.SOURCESREVENUE RECONCILIATIONREVENUEGROSSOPERATINGPRE-TAXNETTim HortonsRestaurant HoldingsBurger King brandInternational SegmentPopeyes brandFirehouse SubsTotal revenuesRevenue before reconciliation (calculated)International Segment - Intersegment EliminationsGross profit (calculated)Cost of revenue (calculated)Supply chain cost of sales and Company restaurant expensesIncome from operationsOperating expenses (calculated)General and administrative expensesFranchise and property expenses(Income) loss from equity method investmentsAdvertising expenses and other servicesOther operating expenses (income), netIncome from continuing operations before income taxesOther income (expense), net (calculated)Net incomeIncome tax (benefit) expense from continuing operationsIncome tax (benefit) expense from continuing operationsIncome tax (benefit)expense fromcontinuing operations−$133.00 MRevenue before reconciliation (calculated)Revenue beforereconciliation(calculated)$2.53 BGross profit (calculated)Gross profit(calculated)$1.40 BTotal revenuesTotal revenues$2.53 BIncome from operationsIncome from operations$696.00 MNet incomeNet income$704.00 MTim HortonsTH$1.14 BIncome from continuing operations before income taxesIncome from continuingoperations beforeincome taxes$571.00 MOperating expenses (calculated)Operating expenses(calculated)$702.00 MGeneral and administrative expensesGeneral andadministrative expenses$183.00 MRestaurant HoldingsRH$487.00 MOther income (expense), net (calculated)Other income,net (calculated)−$125.00 MCost of revenue (calculated)Cost of revenue(calculated)$1.13 BBurger King brandBurger King brand$345.00 MFranchise and property expensesFranchise and property expenses$151.00 M(Income) loss from equity method investments(Income) loss from equitymethod investments−$6.00 MInternational SegmentINTL$289.00 MSupply chain cost of sales and Company restaurant expensesSupply chain cost ofsales and Companyrestaurant expenses$1.13 BPopeyes brandPopeyes brand$204.00 MAdvertising expenses and other servicesAdvertising expensesand other services$354.00 MInternational Segment - Intersegment EliminationsIC Elim.: INTL−$1.00 MFirehouse SubsFHS$65.00 MOther operating expenses (income), netOther operatingexpenses (income), net$20.00 M
Chart details

RESTAURANT BRANDS INTERNATIONAL INC. (QSR) FY2026 Q3 P&L / Income Statement

Income statement for 2026-07-01 through 2026-09-30. View: Business segment (Schedule of Segment Reporting). Revenue uses this breakdown; costs and expenses retain the consolidated categories.

Total revenues
2,525,000,000 US dollars
Cost of revenue (calculated)
1,127,000,000 US dollars
Gross profit (calculated)
1,398,000,000 US dollars
Operating expenses (calculated)
702,000,000 US dollars
Income from operations
696,000,000 US dollars
Other income (expense), net (calculated)
negative 125,000,000 US dollars
Income from continuing operations before income taxes
571,000,000 US dollars
Income tax (benefit) expense from continuing operations
negative 133,000,000 US dollars
Net income
704,000,000 US dollars
Tim Hortons
1,136,000,000 US dollars
Burger King brand
345,000,000 US dollars
Popeyes brand
204,000,000 US dollars
Firehouse Subs
65,000,000 US dollars
International Segment
289,000,000 US dollars
Restaurant Holdings
487,000,000 US dollars
Supply chain cost of sales and Company restaurant expenses
1,127,000,000 US dollars
Franchise and property expenses
151,000,000 US dollars
Advertising expenses and other services
354,000,000 US dollars
General and administrative expenses
183,000,000 US dollars
(Income) loss from equity method investments
negative 6,000,000 US dollars
Other operating expenses (income), net
20,000,000 US dollars
Revenue before reconciliation (calculated)
2,526,000,000 US dollars. Sum of the reported revenue categories before the separately reported reconciliation.
International Segment - Intersegment Eliminations
negative 1,000,000 US dollars. Reported reconciliation to consolidated revenue.
Net loss from discontinued operations (net of tax of $0)
0 US dollars. Reported below-tax contribution to net income.

Chart connections

  • Revenue less cost of revenue equals gross profit; gross profit less operating expenses equals operating income.
  • Operating income plus other income or expense equals income before tax. Income before tax less income tax expense or benefit, plus the explicitly reported below-tax contributions, equals net income.
  • Reported revenue categories plus the separately reported signed reconciliation equals consolidated revenue.
  • Of which attributable to RESTAURANT BRANDS INTERNATIONAL INC.: $542.00 M; to noncontrolling interests: $162.00 M.
RESTAURANT BRANDS INTERNATIONAL INC. (QSR) FY2026 Q3 Revenue by Business Segment Sankey chart
Free to share unchanged, with credit to Plicit.ai · CC BY-NC-ND 4.0Download PNG

Intelligent Insights for Investors

Which of Restaurant Brands International's businesses brings in the most sales?

Tim Hortons leads, with $1.14 B this quarter, or 45% of the total. Restaurant Holdings is next, with $487.00 M, or 19%.

Which parts of Restaurant Brands International's sales by business drove the change over the past year?

The biggest push came from Restaurant Holdings, which grew 6.1% and supplied 37% of the rise in revenue this quarter. The rest of the rise came from other parts.

Intelligent Insights for Employees

Which part of Restaurant Brands International's sales by business grew fastest over the past year?

Firehouse Subs grew fastest, by 8% from a year earlier, outpacing the 3% growth of the whole. A part growing faster than the total takes a bigger slice of the mix.

Product waitlist

Health Check and Teardown for your own company

A health check uncovers insights of your private books, not a public ticker. Join this list to get notified as soon as we go-live!